0001753706falseFY2022http://fasb.org/us-gaap/2022#ProductMemberhttp://fasb.org/us-gaap/2022#ProductMemberhttp://fasb.org/us-gaap/2022#ProductMemberhttp://fasb.org/us-gaap/2022#ProductMemberP1Y.500http://fasb.org/us-gaap/2022#PensionPlansDefinedBenefitMemberhttp://fasb.org/us-gaap/2022#OtherNonoperatingIncomeExpensehttp://fasb.org/us-gaap/2022#OtherNonoperatingIncomeExpensehttp://fasb.org/us-gaap/2022#OtherNonoperatingIncomeExpensehttp://fasb.org/us-gaap/2022#OtherNonoperatingIncomeExpensehttp://fasb.org/us-gaap/2022#OtherNonoperatingIncomeExpensehttp://fasb.org/us-gaap/2022#OtherNonoperatingIncomeExpensehttp://fasb.org/us-gaap/2022#OtherNonoperatingIncomeExpensehttp://fasb.org/us-gaap/2022#OtherNonoperatingIncomeExpensehttp://fasb.org/us-gaap/2022#OtherNonoperatingIncomeExpensehttp://fasb.org/us-gaap/2022#OtherNonoperatingIncomeExpensehttp://fasb.org/us-gaap/2022#OtherNonoperatingIncomeExpensehttp://fasb.org/us-gaap/2022#OtherNonoperatingIncomeExpenseP1Y00017537062022-01-012022-12-310001753706us-gaap:CommonStockMember2022-01-012022-12-310001753706us-gaap:WarrantMember2022-01-012022-12-3100017537062022-06-30iso4217:USD00017537062023-03-10xbrli:shares00017537062022-12-3100017537062021-12-31iso4217:USDxbrli:shares00017537062020-01-012020-06-2500017537062021-01-012021-12-3100017537062020-06-262020-12-3100017537062019-12-310001753706free:PredecessorsMember2020-06-250001753706us-gaap:CommonStockMember2020-06-250001753706us-gaap:AdditionalPaidInCapitalMember2020-06-250001753706us-gaap:RetainedEarningsMember2020-06-250001753706us-gaap:AccumulatedOtherComprehensiveIncomeMember2020-06-2500017537062020-06-250001753706us-gaap:AdditionalPaidInCapitalMember2020-06-262020-12-310001753706us-gaap:CommonStockMember2020-06-262020-12-310001753706us-gaap:RetainedEarningsMember2020-06-262020-12-310001753706us-gaap:AccumulatedOtherComprehensiveIncomeMember2020-06-262020-12-310001753706us-gaap:CommonStockMember2020-12-310001753706us-gaap:AdditionalPaidInCapitalMember2020-12-310001753706us-gaap:RetainedEarningsMember2020-12-310001753706us-gaap:AccumulatedOtherComprehensiveIncomeMember2020-12-3100017537062020-12-310001753706us-gaap:AdditionalPaidInCapitalMembersrt:RestatementAdjustmentMember2020-12-310001753706us-gaap:RetainedEarningsMembersrt:RestatementAdjustmentMember2020-12-310001753706srt:RestatementAdjustmentMember2020-12-310001753706us-gaap:AdditionalPaidInCapitalMember2021-01-012021-12-310001753706us-gaap:RetainedEarningsMember2021-01-012021-12-310001753706us-gaap:AccumulatedOtherComprehensiveIncomeMember2021-01-012021-12-310001753706us-gaap:CommonStockMember2021-01-012021-12-310001753706us-gaap:CommonStockMember2021-12-310001753706us-gaap:AdditionalPaidInCapitalMember2021-12-310001753706us-gaap:RetainedEarningsMember2021-12-310001753706us-gaap:AccumulatedOtherComprehensiveIncomeMember2021-12-310001753706us-gaap:AdditionalPaidInCapitalMember2022-01-012022-12-310001753706us-gaap:RetainedEarningsMember2022-01-012022-12-310001753706us-gaap:AccumulatedOtherComprehensiveIncomeMember2022-01-012022-12-310001753706us-gaap:CommonStockMember2022-01-012022-12-310001753706us-gaap:CommonStockMember2022-12-310001753706us-gaap:AdditionalPaidInCapitalMember2022-12-310001753706us-gaap:RetainedEarningsMember2022-12-310001753706us-gaap:AccumulatedOtherComprehensiveIncomeMember2022-12-310001753706us-gaap:CommonStockMember2020-06-252020-06-2500017537062020-06-252020-06-250001753706us-gaap:BuildingMembersrt:MinimumMember2022-01-012022-12-310001753706srt:MaximumMemberus-gaap:BuildingMember2022-01-012022-12-310001753706us-gaap:PropertyPlantAndEquipmentOtherTypesMembersrt:MinimumMember2022-01-012022-12-310001753706srt:MaximumMemberus-gaap:PropertyPlantAndEquipmentOtherTypesMember2022-01-012022-12-310001753706free:SweetenersAndAdjacenciesMember2022-01-012022-12-310001753706free:SweetenersAndAdjacenciesMember2021-01-012021-12-310001753706free:SweetenersAndAdjacenciesMember2020-06-262020-12-310001753706free:SweetenersAndAdjacenciesMember2020-01-012020-06-250001753706free:LicoriceProductsMember2022-01-012022-12-310001753706free:LicoriceProductsMember2021-01-012021-12-310001753706free:LicoriceProductsMember2020-06-262020-12-310001753706free:LicoriceProductsMember2020-01-012020-06-250001753706srt:NorthAmericaMemberfree:BrandedCpgMember2022-01-012022-12-310001753706srt:NorthAmericaMemberfree:BrandedCpgMember2021-01-012021-12-310001753706srt:NorthAmericaMemberfree:BrandedCpgMember2020-06-262020-12-310001753706srt:NorthAmericaMemberfree:BrandedCpgMember2020-01-012020-06-250001753706srt:EuropeMemberfree:BrandedCpgMember2022-01-012022-12-310001753706srt:EuropeMemberfree:BrandedCpgMember2021-01-012021-12-310001753706srt:EuropeMemberfree:BrandedCpgMember2020-06-262020-12-310001753706srt:EuropeMemberfree:BrandedCpgMember2020-01-012020-06-250001753706free:IndiaMiddleEastAndAfricaMemberfree:BrandedCpgMember2022-01-012022-12-310001753706free:IndiaMiddleEastAndAfricaMemberfree:BrandedCpgMember2021-01-012021-12-310001753706free:IndiaMiddleEastAndAfricaMemberfree:BrandedCpgMember2020-06-262020-12-310001753706free:IndiaMiddleEastAndAfricaMemberfree:BrandedCpgMember2020-01-012020-06-250001753706srt:AsiaPacificMemberfree:BrandedCpgMember2022-01-012022-12-310001753706srt:AsiaPacificMemberfree:BrandedCpgMember2021-01-012021-12-310001753706srt:AsiaPacificMemberfree:BrandedCpgMember2020-06-262020-12-310001753706srt:AsiaPacificMemberfree:BrandedCpgMember2020-01-012020-06-250001753706srt:LatinAmericaMemberfree:BrandedCpgMember2022-01-012022-12-310001753706srt:LatinAmericaMemberfree:BrandedCpgMember2021-01-012021-12-310001753706srt:LatinAmericaMemberfree:BrandedCpgMember2020-06-262020-12-310001753706srt:LatinAmericaMemberfree:BrandedCpgMember2020-01-012020-06-250001753706free:FlavorsIngredientsMember2022-01-012022-12-310001753706free:FlavorsIngredientsMember2021-01-012021-12-310001753706free:FlavorsIngredientsMember2020-06-262020-12-310001753706free:FlavorsIngredientsMember2020-01-012020-06-250001753706us-gaap:FacilityClosingMember2021-01-012021-12-310001753706us-gaap:EmployeeSeveranceMember2021-01-012021-12-310001753706us-gaap:EmployeeSeveranceMember2020-06-262020-12-310001753706us-gaap:EmployeeSeveranceMember2022-12-310001753706us-gaap:EmployeeSeveranceMember2021-12-310001753706free:WarrantsAndRightsOutstandingMemberus-gaap:FairValueInputsLevel3Memberus-gaap:PrivatePlacementMember2020-12-310001753706free:MerisantAndMafcoWorldwideMembersrt:RestatementAdjustmentMember2021-03-310001753706srt:RestatementAdjustmentMember2021-01-012021-06-300001753706free:SwerveMember2020-11-102020-11-1000017537062020-11-102020-11-100001753706us-gaap:RevolvingCreditFacilityMember2020-11-100001753706free:SwerveMember2021-12-310001753706free:SwerveMember2020-12-310001753706free:SwerveMember2020-11-100001753706free:SwerveMemberus-gaap:CustomerRelationshipsMember2020-11-100001753706free:SwerveMemberus-gaap:CustomerRelationshipsMember2020-11-102020-11-100001753706us-gaap:TradeNamesMemberfree:SwerveMember2020-11-100001753706us-gaap:TradeNamesMemberfree:SwerveMember2020-11-102020-11-100001753706free:WholesomeMember2021-02-052021-02-050001753706free:WholesomeMember2021-02-050001753706free:WholesomeMember2022-12-310001753706free:WholesomeMember2021-12-310001753706free:WholesomeMember2022-02-232022-02-230001753706free:WholesomeMember2022-01-012022-03-310001753706free:WholesomeMemberus-gaap:CustomerRelationshipsMember2021-02-050001753706free:WholesomeMemberus-gaap:CustomerRelationshipsMember2021-02-052021-02-050001753706free:WholesomeMemberus-gaap:TradeNamesMember2021-02-050001753706free:WholesomeMemberus-gaap:TradeNamesMember2021-02-052021-02-050001753706free:WholesomeMember2021-02-062021-12-310001753706free:WholesomeMember2021-01-012021-12-3100017537062020-01-012020-12-31free:lease0001753706srt:MinimumMember2022-12-310001753706srt:MaximumMember2022-12-31xbrli:pure0001753706us-gaap:MachineryAndEquipmentMember2022-12-310001753706us-gaap:MachineryAndEquipmentMember2021-12-310001753706us-gaap:BuildingAndBuildingImprovementsMember2022-12-310001753706us-gaap:BuildingAndBuildingImprovementsMember2021-12-310001753706free:DepreciablePropertyPlantAndEquipmentMember2022-12-310001753706free:DepreciablePropertyPlantAndEquipmentMember2021-12-310001753706us-gaap:LandMember2022-12-310001753706us-gaap:LandMember2021-12-310001753706us-gaap:ConstructionInProgressMember2022-12-310001753706us-gaap:ConstructionInProgressMember2021-12-310001753706srt:MinimumMemberus-gaap:CustomerRelationshipsMember2022-01-012022-12-310001753706srt:MaximumMemberus-gaap:CustomerRelationshipsMember2022-01-012022-12-310001753706us-gaap:CustomerRelationshipsMember2022-12-310001753706us-gaap:CustomerRelationshipsMember2021-12-310001753706us-gaap:TradeNamesMember2022-01-012022-12-310001753706us-gaap:TradeNamesMember2022-12-310001753706us-gaap:TradeNamesMember2021-12-310001753706free:ProductFormulationsMember2022-12-310001753706free:ProductFormulationsMember2021-12-310001753706srt:WeightedAverageMember2022-01-012022-12-310001753706us-gaap:CustomerRelationshipsMembersrt:WeightedAverageMember2022-01-012022-12-310001753706us-gaap:TradeNamesMembersrt:WeightedAverageMember2022-01-012022-12-310001753706free:BrandedCpgMember2020-12-310001753706free:FlavorsIngredientsMember2020-12-310001753706free:BrandedCpgMember2021-01-012021-12-310001753706free:BrandedCpgMember2021-12-310001753706free:FlavorsIngredientsMember2021-12-310001753706free:BrandedCpgMember2022-01-012022-12-310001753706free:BrandedCpgMember2022-12-310001753706free:FlavorsIngredientsMember2022-12-3100017537062022-10-012022-12-310001753706srt:NorthAmericaMember2022-10-012022-12-310001753706free:LATAMMember2022-10-012022-12-310001753706srt:NorthAmericaMember2022-12-310001753706free:LATAMMember2022-12-3100017537062020-01-012020-03-310001753706free:MafcoWorldwideMember2020-01-012020-03-310001753706free:MerisantMember2020-01-012020-03-310001753706free:MerisantAndMafcoWorldwideMember2020-01-012020-03-310001753706us-gaap:SecuredDebtMemberfree:SeniorSecuredFirstLienTermLoanFacilityMember2022-12-310001753706us-gaap:SecuredDebtMemberfree:SeniorSecuredFirstLienTermLoanFacilityMember2021-12-310001753706us-gaap:RevolvingCreditFacilityMemberfree:FirstLienRevolvingCreditFacilityMember2022-12-310001753706us-gaap:RevolvingCreditFacilityMemberfree:FirstLienRevolvingCreditFacilityMember2021-12-310001753706us-gaap:SecuredDebtMemberfree:TermLoanFacilityMember2021-12-310001753706us-gaap:RevolvingCreditFacilityMemberfree:AmendedRevolvingCreditFacilityMember2022-06-150001753706us-gaap:RevolvingCreditFacilityMember2022-12-310001753706us-gaap:RevolvingCreditFacilityMember2021-12-310001753706free:CreditFacilitiesMember2021-02-040001753706free:CreditFacilitiesMember2021-02-042021-02-040001753706free:CreditFacilitiesMember2021-02-052021-02-050001753706free:CreditFacilitiesMember2021-02-050001753706us-gaap:RevolvingCreditFacilityMemberfree:RevolvingFacilityMember2021-12-310001753706free:OneMonthSOFRMemberfree:CreditFacilitiesMember2022-06-152022-06-150001753706free:ThreeMonthSOFRMemberfree:CreditFacilitiesMember2022-06-152022-06-150001753706free:SixMonthSOFRMemberfree:CreditFacilitiesMember2022-06-152022-06-150001753706us-gaap:FederalFundsEffectiveSwapRateMemberfree:CreditFacilitiesMember2022-06-152022-06-150001753706us-gaap:SecuredOvernightFinancingRateSofrOvernightIndexSwapRateMemberfree:CreditFacilitiesMember2022-06-152022-06-150001753706us-gaap:RevolvingCreditFacilityMemberfree:AmendedRevolvingCreditFacilityMemberus-gaap:BaseRateMember2022-06-152022-06-150001753706us-gaap:RevolvingCreditFacilityMemberus-gaap:SecuredOvernightFinancingRateSofrOvernightIndexSwapRateMemberfree:AmendedRevolvingCreditFacilityMember2022-06-152022-06-150001753706us-gaap:SecuredDebtMemberfree:SeniorSecuredFirstLienTermLoanFacilityMemberus-gaap:BaseRateMember2022-06-152022-06-150001753706us-gaap:SecuredOvernightFinancingRateSofrOvernightIndexSwapRateMemberus-gaap:SecuredDebtMemberfree:SeniorSecuredFirstLienTermLoanFacilityMember2022-06-152022-06-150001753706free:AmendedRevolvingCreditFacilityMember2022-06-152022-06-150001753706free:DebtRedemptionTerm1Memberfree:CreditFacilitiesMember2021-02-052021-02-050001753706free:DebtRedemptionTerm1Memberfree:CreditFacilitiesMember2021-02-050001753706free:DebtRedemptionTerm2Memberfree:CreditFacilitiesMember2021-02-052021-02-050001753706free:DebtRedemptionTerm3Memberfree:CreditFacilitiesMember2021-02-052021-02-050001753706free:DebtRedemptionTerm3Memberfree:DebtInstrumentAgreementRequirementsRequirementOneMemberfree:CreditFacilitiesMember2021-02-052021-02-050001753706free:DebtRedemptionTerm3Memberfree:DebtInstrumentAgreementRequirementsRequirementOneMemberfree:CreditFacilitiesMember2021-02-050001753706free:DebtRedemptionTerm3Memberfree:DebtInstrumentAgreementRequirementsRequirementTwoMemberfree:CreditFacilitiesMember2021-02-052021-02-050001753706free:DebtRedemptionTerm3Memberfree:DebtInstrumentAgreementRequirementsRequirementTwoMemberfree:CreditFacilitiesMember2021-02-050001753706free:PublicWarrantsMember2020-06-250001753706us-gaap:PrivatePlacementMember2020-06-250001753706free:PublicWarrantsMember2022-12-310001753706free:PublicWarrantsMember2021-12-310001753706us-gaap:PrivatePlacementMember2022-12-310001753706us-gaap:PrivatePlacementMember2021-12-310001753706free:PublicWarrantsMember2022-01-012022-12-310001753706us-gaap:PrivatePlacementMember2022-01-012022-12-310001753706us-gaap:CommonClassAMember2020-06-250001753706us-gaap:MeasurementInputOfferedPriceMemberus-gaap:PrivatePlacementMember2022-12-310001753706us-gaap:MeasurementInputOfferedPriceMemberus-gaap:PrivatePlacementMember2021-12-310001753706us-gaap:PrivatePlacementMemberus-gaap:MeasurementInputExercisePriceMember2022-12-310001753706us-gaap:PrivatePlacementMemberus-gaap:MeasurementInputExercisePriceMember2021-12-310001753706us-gaap:MeasurementInputRiskFreeInterestRateMemberus-gaap:PrivatePlacementMember2022-12-310001753706us-gaap:MeasurementInputRiskFreeInterestRateMemberus-gaap:PrivatePlacementMember2021-12-310001753706us-gaap:MeasurementInputPriceVolatilityMemberus-gaap:PrivatePlacementMember2022-12-310001753706us-gaap:MeasurementInputPriceVolatilityMemberus-gaap:PrivatePlacementMember2021-12-310001753706us-gaap:PrivatePlacementMemberus-gaap:MeasurementInputExpectedTermMember2022-12-310001753706us-gaap:PrivatePlacementMemberus-gaap:MeasurementInputExpectedTermMember2021-12-310001753706us-gaap:PrivatePlacementMemberus-gaap:MeasurementInputExpectedDividendRateMember2022-12-310001753706us-gaap:PrivatePlacementMemberus-gaap:MeasurementInputExpectedDividendRateMember2021-12-310001753706free:WarrantsAndRightsOutstandingMemberus-gaap:FairValueInputsLevel3Memberus-gaap:PrivatePlacementMembersrt:RestatementAdjustmentMember2020-12-310001753706free:WarrantsAndRightsOutstandingMemberus-gaap:FairValueInputsLevel3Memberus-gaap:PrivatePlacementMember2021-01-012021-12-310001753706free:WarrantsAndRightsOutstandingMemberus-gaap:FairValueInputsLevel3Memberus-gaap:PrivatePlacementMember2021-12-310001753706free:WarrantsAndRightsOutstandingMemberus-gaap:FairValueInputsLevel3Memberus-gaap:PrivatePlacementMember2022-01-012022-12-310001753706free:WarrantsAndRightsOutstandingMemberus-gaap:FairValueInputsLevel3Memberus-gaap:PrivatePlacementMember2022-12-310001753706us-gaap:PublicUtilitiesInventoryRawMaterialsMember2022-12-310001753706free:MarketDataResearchTechnologyServicesAndCapitalProjectsMember2022-12-310001753706us-gaap:StateAndLocalJurisdictionMember2022-12-310001753706us-gaap:DomesticCountryMember2022-12-310001753706free:FederalIRCMember2022-12-310001753706us-gaap:MexicanTaxAuthorityMember2022-12-310001753706us-gaap:LuxembourgInlandRevenueMember2022-12-310001753706us-gaap:MinistryOfFinanceIndiaMember2022-12-310001753706us-gaap:StateAdministrationOfTaxationChinaMember2022-12-310001753706country:AR2022-12-3100017537062021-10-012021-12-31free:participant00017537062022-02-112022-02-1100017537062022-01-012022-03-310001753706us-gaap:NonqualifiedPlanMember2022-12-310001753706us-gaap:NonqualifiedPlanMember2021-12-310001753706us-gaap:SellingGeneralAndAdministrativeExpensesMember2022-01-012022-12-310001753706us-gaap:SellingGeneralAndAdministrativeExpensesMember2021-01-012021-12-310001753706us-gaap:SellingGeneralAndAdministrativeExpensesMember2020-06-262020-12-310001753706us-gaap:SellingGeneralAndAdministrativeExpensesMember2020-01-012020-06-250001753706us-gaap:OtherNonoperatingIncomeExpenseMember2022-01-012022-12-310001753706us-gaap:OtherNonoperatingIncomeExpenseMember2021-01-012021-12-310001753706us-gaap:OtherNonoperatingIncomeExpenseMember2020-06-262020-12-310001753706us-gaap:OtherNonoperatingIncomeExpenseMember2020-01-012020-06-250001753706us-gaap:FundedPlanMember2022-12-310001753706us-gaap:FundedPlanMember2021-12-310001753706us-gaap:FundedPlanMember2022-01-012022-12-310001753706us-gaap:FundedPlanMember2021-01-012021-12-310001753706srt:MinimumMember2022-01-012022-12-310001753706srt:MaximumMember2022-01-012022-12-310001753706us-gaap:UnfundedPlanMember2022-12-310001753706us-gaap:UnfundedPlanMember2021-12-310001753706us-gaap:UnfundedPlanMember2022-01-012022-12-310001753706us-gaap:UnfundedPlanMember2021-01-012021-12-310001753706us-gaap:DefinedBenefitPlanCashAndCashEquivalentsMemberus-gaap:FairValueInputsLevel1Member2022-12-310001753706us-gaap:DefinedBenefitPlanCashAndCashEquivalentsMemberus-gaap:FairValueInputsLevel2Member2022-12-310001753706us-gaap:DefinedBenefitPlanCashAndCashEquivalentsMemberus-gaap:FairValueInputsLevel3Member2022-12-310001753706us-gaap:DefinedBenefitPlanCashAndCashEquivalentsMemberus-gaap:FairValueInputsLevel12And3Member2022-12-310001753706us-gaap:FairValueInputsLevel1Member2022-12-310001753706us-gaap:FairValueInputsLevel2Member2022-12-310001753706us-gaap:FairValueInputsLevel3Member2022-12-310001753706us-gaap:FairValueInputsLevel12And3Member2022-12-310001753706us-gaap:DefinedBenefitPlanCashAndCashEquivalentsMemberus-gaap:FairValueInputsLevel1Member2021-12-310001753706us-gaap:DefinedBenefitPlanCashAndCashEquivalentsMemberus-gaap:FairValueInputsLevel2Member2021-12-310001753706us-gaap:DefinedBenefitPlanCashAndCashEquivalentsMemberus-gaap:FairValueInputsLevel3Member2021-12-310001753706us-gaap:DefinedBenefitPlanCashAndCashEquivalentsMemberus-gaap:FairValueInputsLevel12And3Member2021-12-310001753706us-gaap:USGovernmentAgenciesDebtSecuritiesMemberus-gaap:FairValueInputsLevel1Member2021-12-310001753706us-gaap:USGovernmentAgenciesDebtSecuritiesMemberus-gaap:FairValueInputsLevel2Member2021-12-310001753706us-gaap:USGovernmentAgenciesDebtSecuritiesMemberus-gaap:FairValueInputsLevel3Member2021-12-310001753706us-gaap:USGovernmentAgenciesDebtSecuritiesMemberus-gaap:FairValueInputsLevel12And3Member2021-12-310001753706us-gaap:CorporateBondSecuritiesMemberus-gaap:FairValueInputsLevel1Member2021-12-310001753706us-gaap:CorporateBondSecuritiesMemberus-gaap:FairValueInputsLevel2Member2021-12-310001753706us-gaap:CorporateBondSecuritiesMemberus-gaap:FairValueInputsLevel3Member2021-12-310001753706us-gaap:CorporateBondSecuritiesMemberus-gaap:FairValueInputsLevel12And3Member2021-12-310001753706us-gaap:FairValueInputsLevel1Member2021-12-310001753706us-gaap:FairValueInputsLevel2Member2021-12-310001753706us-gaap:FairValueInputsLevel3Member2021-12-310001753706us-gaap:FairValueInputsLevel12And3Member2021-12-310001753706us-gaap:FairValueMeasuredAtNetAssetValuePerShareMember2021-12-310001753706us-gaap:ForeignPlanMember2022-12-310001753706us-gaap:ForeignPlanMember2021-12-310001753706us-gaap:ForeignPlanMember2022-01-012022-12-310001753706us-gaap:ForeignPlanMember2021-01-012021-12-310001753706us-gaap:ForeignPlanMember2020-06-262020-12-310001753706us-gaap:ForeignPlanMember2020-01-012020-06-2500017537062021-01-012021-06-300001753706free:A2020LongTermIncentivePlanMember2020-06-242020-06-240001753706us-gaap:RestrictedStockUnitsRSUMembersrt:MinimumMember2022-01-012022-12-310001753706us-gaap:RestrictedStockUnitsRSUMembersrt:MaximumMember2022-01-012022-12-310001753706us-gaap:RestrictedStockMember2022-01-012022-12-310001753706us-gaap:PerformanceSharesMember2022-01-012022-12-310001753706free:ManagementBonusesMember2021-01-012021-12-310001753706us-gaap:RestrictedStockUnitsRSUMember2021-12-310001753706us-gaap:RestrictedStockUnitsRSUMember2021-01-012021-12-310001753706us-gaap:RestrictedStockUnitsRSUMember2022-01-012022-12-310001753706us-gaap:RestrictedStockUnitsRSUMember2022-12-310001753706us-gaap:RestrictedStockUnitsRSUMember2020-01-012020-12-310001753706us-gaap:RestrictedStockUnitsRSUMember2020-06-262020-12-310001753706us-gaap:RestrictedStockMember2021-12-310001753706us-gaap:RestrictedStockMember2021-01-012021-12-310001753706us-gaap:RestrictedStockMember2022-12-310001753706us-gaap:RestrictedStockMember2020-06-262020-12-310001753706us-gaap:PerformanceSharesMember2021-12-310001753706us-gaap:PerformanceSharesMember2021-01-012021-12-310001753706us-gaap:PerformanceSharesMember2022-12-3100017537062020-09-0800017537062020-09-082020-09-080001753706us-gaap:WarrantMember2022-01-012022-12-310001753706us-gaap:RestrictedStockUnitsRSUMember2022-01-012022-12-310001753706us-gaap:RestrictedStockMember2022-01-012022-12-310001753706us-gaap:WarrantMember2020-06-262020-12-310001753706us-gaap:RestrictedStockUnitsRSUMember2020-06-262020-12-310001753706us-gaap:RestrictedStockMember2020-06-262020-12-310001753706free:PerformanceStockUnitsPSUsMember2022-01-012022-12-310001753706free:PerformanceStockUnitsPSUsMember2021-01-012021-12-310001753706us-gaap:AccumulatedTranslationAdjustmentMember2020-12-310001753706us-gaap:AccumulatedDefinedBenefitPlansAdjustmentMember2020-12-310001753706us-gaap:AccumulatedTranslationAdjustmentMember2021-01-012021-12-310001753706us-gaap:AccumulatedDefinedBenefitPlansAdjustmentMember2021-01-012021-12-310001753706us-gaap:AccumulatedTranslationAdjustmentMember2021-12-310001753706us-gaap:AccumulatedDefinedBenefitPlansAdjustmentMember2021-12-310001753706us-gaap:AccumulatedTranslationAdjustmentMember2022-01-012022-12-310001753706us-gaap:AccumulatedDefinedBenefitPlansAdjustmentMember2022-01-012022-12-310001753706us-gaap:AccumulatedTranslationAdjustmentMember2022-12-310001753706us-gaap:AccumulatedDefinedBenefitPlansAdjustmentMember2022-12-310001753706us-gaap:RevolvingCreditFacilityMemberfree:WescoUsLlcMember2018-03-310001753706us-gaap:RevolvingCreditFacilityMemberus-gaap:LondonInterbankOfferedRateLIBORMemberfree:WescoUsLlcMember2018-03-012018-03-310001753706us-gaap:RevolvingCreditFacilityMemberfree:WescoUsLlcMember2020-06-250001753706free:WescoUsLlcMember2020-01-012020-06-250001753706free:WatermillMember2020-07-310001753706free:WatermillMember2021-01-012021-12-310001753706free:WatermillMember2020-06-262020-12-310001753706free:WholesomeMemberfree:WatermillMember2021-01-012021-12-310001753706free:WatermillMemberfree:SwerveMember2020-06-262020-12-310001753706free:WSServicesMemberus-gaap:LimitedLiabilityCompanyMember2022-12-310001753706free:WSServicesMemberus-gaap:OtherAssetsMemberus-gaap:LimitedLiabilityCompanyMember2022-12-310001753706free:WSServicesMemberus-gaap:OtherAssetsMemberus-gaap:LimitedLiabilityCompanyMember2021-12-310001753706us-gaap:LimitedLiabilityCompanyMember2022-01-012022-12-310001753706us-gaap:LimitedLiabilityCompanyMember2021-02-062021-12-310001753706us-gaap:LimitedLiabilityCompanyMember2022-12-310001753706us-gaap:LimitedLiabilityCompanyMember2021-12-31free:segment0001753706us-gaap:OperatingSegmentsMemberfree:BrandedCpgMember2022-01-012022-12-310001753706us-gaap:OperatingSegmentsMemberfree:BrandedCpgMember2021-01-012021-12-310001753706us-gaap:OperatingSegmentsMemberfree:BrandedCpgMember2020-06-262020-12-310001753706us-gaap:OperatingSegmentsMemberfree:BrandedCpgMember2020-01-012020-06-250001753706free:FlavorsIngredientsMemberus-gaap:OperatingSegmentsMember2022-01-012022-12-310001753706free:FlavorsIngredientsMemberus-gaap:OperatingSegmentsMember2021-01-012021-12-310001753706free:FlavorsIngredientsMemberus-gaap:OperatingSegmentsMember2020-06-262020-12-310001753706free:FlavorsIngredientsMemberus-gaap:OperatingSegmentsMember2020-01-012020-06-250001753706us-gaap:OperatingSegmentsMember2022-01-012022-12-310001753706us-gaap:OperatingSegmentsMember2021-01-012021-12-310001753706us-gaap:OperatingSegmentsMember2020-06-262020-12-310001753706us-gaap:OperatingSegmentsMember2020-01-012020-06-250001753706us-gaap:CorporateNonSegmentMember2022-01-012022-12-310001753706us-gaap:CorporateNonSegmentMember2021-01-012021-12-310001753706us-gaap:CorporateNonSegmentMember2020-06-262020-12-310001753706us-gaap:CorporateNonSegmentMember2020-01-012020-06-250001753706srt:NorthAmericaMember2022-01-012022-12-310001753706srt:NorthAmericaMember2021-01-012021-12-310001753706srt:NorthAmericaMember2020-06-262020-12-310001753706srt:NorthAmericaMember2020-01-012020-06-250001753706srt:EuropeMember2022-01-012022-12-310001753706srt:EuropeMember2021-01-012021-12-310001753706srt:EuropeMember2020-06-262020-12-310001753706srt:EuropeMember2020-01-012020-06-250001753706free:IndiaMiddleEastAndAfricaMember2022-01-012022-12-310001753706free:IndiaMiddleEastAndAfricaMember2021-01-012021-12-310001753706free:IndiaMiddleEastAndAfricaMember2020-06-262020-12-310001753706free:IndiaMiddleEastAndAfricaMember2020-01-012020-06-250001753706srt:AsiaPacificMember2022-01-012022-12-310001753706srt:AsiaPacificMember2021-01-012021-12-310001753706srt:AsiaPacificMember2020-06-262020-12-310001753706srt:AsiaPacificMember2020-01-012020-06-250001753706srt:LatinAmericaMember2022-01-012022-12-310001753706srt:LatinAmericaMember2021-01-012021-12-310001753706srt:LatinAmericaMember2020-06-262020-12-310001753706srt:LatinAmericaMember2020-01-012020-06-250001753706us-gaap:CustomerConcentrationRiskMemberfree:OneCustomerMemberus-gaap:RevenueFromContractWithCustomerMemberfree:BrandedCpgMember2022-01-012022-12-310001753706us-gaap:CustomerConcentrationRiskMemberfree:OneCustomerMemberus-gaap:RevenueFromContractWithCustomerMemberfree:BrandedCpgMember2021-01-012021-12-310001753706us-gaap:SupplierConcentrationRiskMemberus-gaap:CostOfGoodsProductLineMemberfree:UzbekistanManufacturerMember2022-01-012022-12-310001753706country:US2022-12-310001753706country:US2021-12-310001753706country:CN2022-12-310001753706country:CN2021-12-310001753706country:CZ2022-12-310001753706country:CZ2021-12-310001753706country:FR2022-12-310001753706country:FR2021-12-310001753706free:OTHERFOREIGNCOUNTRIESMember2022-12-310001753706free:OTHERFOREIGNCOUNTRIESMember2021-12-31
UNITED STATES
SECURITIES AND EXCHANGE COMMISSION
Washington, D.C. 20549
Form 10-K
☒ ANNUAL REPORT PURSUANT TO SECTION 13 OR 15(d) OF THE SECURITIES EXCHANGE ACT OF 1934
For the fiscal year ended December 31, 2022
☐ TRANSITION REPORT PURSUANT TO SECTION 13 OR 15(d) OF THE SECURITIES EXCHANGE ACT OF 1934
For the transition period from to
Commission file number: 001-38880
Whole Earth Brands, Inc.
(Exact name of registrant as specified in its charter)
| | | | | | | | |
| Delaware | | 38-4101973 |
(State or other jurisdiction of
incorporation or organization) | | (I.R.S. Employer
Identification Number) |
| | | | | | | | |
125 S. Wacker Drive, Suite 1250 Chicago, Illinois | | 60606 |
| (Address of principal executive offices) | | (Zip Code) |
Registrant’s telephone number: (312) 840-6000
Securities registered pursuant to Section 12(b) of the Act:
| | | | | | | | | | | | | | |
| Title of Each Class | | Trading Symbol(s) | | Name of Each Exchange on Which Registered |
| Common stock, par value $0.0001 per share | | FREE | | The NASDAQ Stock Market LLC |
| Warrants to purchase one-half of one share of common stock | | FREEW | | The NASDAQ Stock Market LLC |
| | | | |
Securities registered pursuant to Section 12(g) of the Act: None
Indicate by check mark if the registrant is a well-known seasoned issuer, as defined in Rule 405 of the Securities Act.
Yes ☐ No ☒
Indicate by check mark if the registrant is not required to file reports pursuant to Section 13 or Section 15(d) of the Exchange Act.
Yes ☐ No ☒
Indicate by check mark whether the registrant (1) has filed all reports required to be filed by Section 13 or 15(d) of the Securities Exchange Act of 1934 during the preceding 12 months (or for such shorter period that the registrant was required to file such reports), and (2) has been subject to such filing requirements for the past 90 days.
Yes ☒ No ☐
Indicate by check mark whether the registrant has submitted electronically every Interactive Data File required to be submitted pursuant to Rule 405 of Regulation S-T (§ 232.405 of this chapter) during the preceding 12 months (or for such shorter period that the registrant was required to submit such files). Yes ☒ No ☐
Indicate by check mark whether the registrant is a large accelerated filer, an accelerated filer, a non-accelerated filer, smaller reporting company or an emerging growth company. See definitions of “large accelerated filer,” “accelerated filer,” “smaller reporting company” and “emerging growth company” in Rule 12b-2 of the Exchange Act.
| | | | | |
Large accelerated filer ☐ | Accelerated filer ☒ |
Non-accelerated filer ☐ | Smaller reporting company ☐ |
| Emerging growth company ☒ |
If an emerging growth company, indicate by check mark if the registrant has elected not to use the extended transition period for complying with any new or revised financial accounting standards provided pursuant to Section 13(a) of the Exchange Act. ☐
Indicate by check mark whether the registrant has filed a report on and attestation to its management’s assessment of the effectiveness of its internal control over financial reporting under Section 404(b) of the Sarbanes-Oxley Act (15 U.S.C. 7262(b)) by the registered public accounting firm that prepared or issued its audit report. ☐
If securities are registered pursuant to Section 12(b) of the Act, indicate by check mark whether the financial statements of the registrant included in the filing reflect the correction of an error to previously issued financial statements. ☐
Indicate by check mark whether any of those error corrects are restatements that required a recovery analysis of incentive-based compensation received by any of the registrant’s executive officers during the relevant recovery period pursuant to §240.10D-1(b). ☐
Indicate by check mark whether the registrant is a shell company (as defined in Rule 12b-2 of the Exchange Act). Yes ☐ No ☒
As of June 30, 2022, the last business day of the registrant’s most recently completed second fiscal quarter, the aggregate market value of our common stock, par value $0.0001 per share, issued and outstanding, other than shares held by persons who may be deemed affiliates of the registrant, computed by reference to the closing sales price for the common stock on June 30, 2022, as reported on the Nasdaq Capital Market, was $214,242,370.
As of March 10, 2023, there were 42,092,806 shares of the registrant’s common stock, par value $0.0001 per share, issued and outstanding.
DOCUMENTS INCORPORATED BY REFERENCE
Certain information contained in the registrant’s definitive proxy statement relating to its annual meeting of stockholders to be held in 2023, or in an amendment to this Annual Report on Form 10-K, to be filed with the Securities and Exchange Commission (the “SEC”) within 120 days after the end of the fiscal year to which this Annual Report on Form 10-K relates, is incorporated herein by reference where indicated. Except with respect to information specifically incorporated by reference in this Annual Report on Form 10-K, such proxy statement or amendment is not deemed to be filed as part hereof.
TABLE OF CONTENTS
Unless otherwise stated in this report, or the context otherwise requires, references to “Whole Earth Brands,” the “Company,” “we,” or “our” refer to (i) Merisant Company (collectively with its subsidiaries, “Merisant”) and Mafco Worldwide LLC (collectively with its subsidiaries and affiliates, “Mafco Worldwide,” and together with Merisant, “Merisant and MAFCO”) (“Predecessor”) for the period from January 1, 2020 through June 25, 2020 (referred to herein as a “Predecessor Period”) prior to the consummation of the indirect acquisition of Merisant and MAFCO (the “Business Combination”), and (ii) Whole Earth Brands, Inc. and its subsidiaries (the “Successor”) for the period from June 26, 2020 through December 31, 2020 and the years ended December 31, 2021 and 2022 (the “Successor Period”) after the consummation of the Business Combination. Certain figures have been rounded for ease of presentation and may not sum due to rounding.
CAUTIONARY NOTE REGARDING FORWARD-LOOKING STATEMENTS
This Annual Report on Form 10-K contains “forward-looking” statements within the meaning of Section 27A of the Securities Act of 1933, as amended (the “Securities Act”) and Section 21E of the Exchange Act (the “Exchange Act”) concerning us and other matters. These statements may discuss goals, intentions and expectations as to future plans, trends, events, results of operations or financial condition, or otherwise, based on current beliefs of management, as well as assumptions made by, and information currently available to, management.
Forward-looking statements may be accompanied by words such as “achieve,” “aim,” “anticipate,” “believe,” “can,” “continue,” “could,” “drive,” “estimate,” “expect,” “forecast,” “future,” “grow,” “improve,” “increase,” “intend,” “may,” “outlook,” “plan,” “possible,” “potential,” “predict,” “project,” “should,” “target,” “will,” “would,” or similar words, phrases or expressions. These forward-looking statements are subject to risks, uncertainties and other factors, many of which are outside of our control, which could cause actual results to differ materially from the results contemplated by the forward-looking statements. Factors that could cause actual results to differ materially from those in the forward-looking statements include, but are not limited to, our ability to achieve or maintain profitability; the extent of the impact of the COVID-19 pandemic, including the duration, spread, severity, and any recurrence of the COVID-19 pandemic, the duration and scope of related government orders and restrictions, the impact on our employees, and the extent of the impact of the COVID-19 pandemic on overall demand for our products; local, regional, national, and international economic conditions that have deteriorated as a result of the COVID-19 pandemic including the risks of a global recession or a recession in one or more of our key markets, and the impact they may have on us and our customers and management’s assessment of that impact; the projected financial information, anticipated growth rate, and market opportunity of our Branded Consumer Packaged Goods (“Branded CPG”) and Flavors & Ingredients business segments; the ability to maintain the listing of our securities on Nasdaq; the potential liquidity and trading of our public securities; our expected capital requirements and the availability of additional financing; our ability to attract or retain highly qualified personnel, including in accounting and finance roles; extensive and evolving government regulations that impact the way we operate; the effect of the reclassification and treatment of warrants pursuant to ASC Topic 815-40; the impact of the COVID-19 pandemic on our suppliers, including disruptions and inefficiencies in the supply chain; factors relating to the business, operations and financial performance of our Branded CPG and Flavors & Ingredients segments; our success in integrating the various operating companies constituting Merisant and MAFCO; our ability to integrate Wholesome and Swerve (as defined herein) and achieve the anticipated benefits of the transactions in a timely manner or at all; the ongoing military conflict in Ukraine and related economic disruptions and new governmental regulations on our business, including but not limited to the potential impact on our sales, operations and supply chain; adverse changes in the global or regional general business, political and economic conditions, including the impact of continuing uncertainty and instability in certain countries, that could materially affect our global markets and the potential adverse economic impact and related uncertainty caused by these items; our ability to continue to use, maintain, enforce, protect and defend owned and licensed intellectual property, including the Whole Earth® brand; and such other factors as discussed throughout, including in Part I, Item 1A. Risk Factors and Part II, Item 7. Management’s Discussion and Analysis of Financial Condition and Results of Operations, of this Annual Report on Form 10-K.
Although we believe that the expectations reflected in the forward-looking statements are reasonable, our information may be incomplete or limited, and we cannot guarantee future results. Except as required by law, we assume no obligation to update or revise these forward-looking statements for any reason, even if new information becomes available in the future.
PART I
Item 1. Business.
Overview
We are a global food company enabling healthier lifestyles and providing access to high-quality, plant-based sweeteners, flavor enhancers and other foods through our diverse portfolio of trusted brands and delicious products. We operate a proven platform organized into two reportable segments, Branded CPG and Flavors & Ingredients. Our portfolio consists of three main product groups: sweeteners, adjacencies and ingredients.
We were originally formed on August 16, 2018 as Act II Global Acquisition Corp., a Cayman Islands exempted company formed as a blank check company (“Act II”), and consummated our initial public offering (“IPO”) in April 2019. On June 24, 2020, we domesticated into a Delaware corporation and changed our name from “Act II Global Acquisition Corp.” to “Whole Earth Brands, Inc.” On June 25, 2020, we consummated the Business Combination, and in connection therewith, became (i) a successor issuer to Act II by operation of Rule 12g-3(a) promulgated under the Exchange Act; and (ii) the ultimate parent of Merisant and MAFCO. Any data presented in this “Business” section with respect to the year ended December 31, 2020, is presented on a combined basis for the Predecessor and Successor periods. See Part II, Item 7. Management’s Discussion and Analysis of Financial Condition and Results of Operations, of this Annual Report on Form 10-K.
We have continued to pursue our growth strategy, and on November 10, 2020, we executed and closed a definitive Equity Purchase Agreement (the “Swerve Purchase Agreement”) with RF Development, LLC (“RF Development”), Swerve, L.L.C. (“Swerve LLC”), and Swerve IP, L.L.C. (“Swerve IP” and together with Swerve LLC, “Swerve”). Swerve is a manufacturer and marketer of a portfolio of zero and reduced sugar, keto-friendly, and plant-based sweeteners and grain free, gluten free, and low/no sugar baking mixes. We purchased all of the issued and outstanding equity interests of both Swerve LLC and Swerve IP from RF Development, and both Swerve LLC and Swerve IP became wholly-owned subsidiaries of Whole Earth Brands. The transaction was structured to simultaneously sign and close, was not subject to any closing conditions, and closed on November 10, 2020.
On December 17, 2020, we entered into a stock purchase agreement (the “Wholesome Purchase Agreement”) with WSO Investments, Inc. (“WSO Investments” and together with its subsidiaries, “Wholesome”), WSO Holdings, LP (“WSO Partnership”), Edwards Billington and Son, Limited (“EBS”), WSO Holdings, LLC (“WSO LLC,” and together with WSO Partnership and EBS, the “WSO Sellers”), and WSO Partnership, in its capacity as representative for the WSO Sellers. WSO Investments is the direct parent of its wholly-owned subsidiary Wholesome Sweeteners, Incorporated, which was formed to import, market, distribute, and sell organic sugars, unrefined specialty sugars, and related products. The transaction closed on February 5, 2021.
Our Business Segments
The table below describes the percentage of our total annual revenue attributable to each of our segments over each of the three years ended December 31, 2022, 2021 and 2020. For additional financial information relating to our reportable business segments, please refer to Note 18 in our audited consolidated and combined financial statements for the year ended December 31, 2022, included in this Annual Report on Form 10-K (“2022 Audited Financial Statements”).
| | | | | | | | | | | | | | | | | | | |
| 2022 | | 2021 | | 2020 | | |
| Branded CPG | 79 | % | | 79 | % | | 64 | % | | |
| Flavors & Ingredients | 21 | % | | 21 | % | | 36 | % | | |
Branded CPG
Branded CPG, comprised of our Merisant division of operating companies, Wholesome and Swerve, is a global CPG business focused on building a branded portfolio oriented toward serving consumers seeking better-for-you sweeteners across the zero calorie, plant-based, organic, non GMO, and Fair Trade spaces in zero/low calorie sweeteners, honey, agave, baking mix, and baking chocolate segments. Our Branded CPG products are sold under both our flagship brands as well as local and private label brands. Our flagship brands include Whole Earth®, Pure Via®, Wholesome®, Swerve®, Canderel®, Equal® and existing branded adjacencies. Our Branded CPG segment offers a variety of sweetener formulations under each brand to address local consumer preferences and price points. The key ingredients utilized in these products include stevia leaf extract, monk fruit extract, organic sugar, erythritol, xylitol, allulose, aspartame, sucralose and saccharin, all of which are sourced through our global supply chain.
Since the introduction of the original Canderel® and Equal® products in 1979 and 1982, respectively, we have offered consumers high quality alternatives to sugar for daily use. As the global health crisis related to sugar consumption continues to grow, consumers remain focused on finding substitutes for tabletop sugar and sugar-laden products. In recent years, we have met consumer demand by introducing new plant-based sweeteners made from stevia leaf extract, monk fruit extract, allulose and naturally derived sugar alcohols under the Whole Earth®, Swerve® and Pure Via® brands (as well as under the Canderel® and Equal® brands) and introduced low- or no-sugar alternatives to traditionally sugar-laden products such as chocolate, jams, and cereal bars. These initiatives have further established us as a leader in the “better for you” movement away from sugar. Our sweetener products are sold under a variety of forms to satisfy consumers growing usage across diverse consumption occasions. Those forms include sweetener packets, tablets, pouches, jars, and liquid bottles. We distribute our products via the retail, club, food service, and e-commerce channels.
We have expanded our product offerings in recent years into adjacent consumer packaged goods such as jams and chocolate under our well-known CPG brands. We also invest in innovation to develop new product offerings to distribute under our various brands, providing differentiation from our competitors and exciting new products for customers. In addition, our adjacent branded packaged goods such as jams and chocolate are sold in chocolate bars, dried chocolate powder, and jam jars.
Whole Earth®: Whole Earth® is a global brand of plant-based, zero/low-calorie sweeteners primarily marketed in North America, Australia and New Zealand and sold through a variety of channels including grocery, supermarket, drugstores, mass, club, food-service, and e-commerce. Key Whole Earth® sweetener formulations include ingredients such as stevia leaf extract, monk fruit extract, erythritol, and allulose.
Pure Via®: Pure Via® is a global brand of plant-based, low-calorie sweeteners that is primarily marketed in Western Europe and North America. Pure Via®-branded products are sold through a variety of channels including grocery, drugstores, mass, club, food-service, and e-commerce. Key Pure Via® sweetener formulations include stevia leaf extract, erythritol and xylitol.
Wholesome®: Wholesome® is a U.S. leader in organic, fair-trade certified sweeteners, including sugar, honey, agave nectar, molasses, allulose and other natural sweetener products. We acquired this brand in February 2021.
Swerve®: Swerve® is a portfolio of zero and reduced sugar, keto-friendly, and plant-based sweeteners and grain free, gluten free, and low/no sugar baking mixes and is marketed in North America. Swerve® products contain no artificial ingredients, preservatives, flavors, or GMO ingredients. Swerve® sweetener formulations include erythritol, monk fruit, allulose, and reduced sugar blends of sugar and monk fruit; as well as the recently launched no added sugar chocolate baking chips. We acquired this brand in November 2020.
Canderel®: Canderel® is a global brand of low-calorie sweeteners that is primarily marketed in Europe, the Middle East and Africa and, according to AC Nielsen retail data, is the leading sugar-free sweetener in many of its key markets, including France, Belgium, the United Kingdom, and South Africa. Canderel®-branded products are sold through a variety of sales channels including grocery, supermarket, drugstore, mass, club, food-service, and e-commerce. Key Canderel® sweetener formulations include aspartame, sucralose, and stevia leaf extract.
Equal®: Equal® is a global brand of low-calorie sweeteners that is primarily marketed in North America, Asia Pacific, South Africa and Latin America and, according to AC Nielsen retail data, is the leading sugar-free sweetener in many key markets including Australia, New Zealand and Thailand, and is a top-five sugar-free sweetener in the United States. Equal®-branded products are sold through a variety of sales channels including grocery, supermarket, drugstores, mass, club, food-service, and e-commerce. Key Equal® sweetener formulations include aspartame, saccharin, sucralose, and stevia leaf extract.
Branded Adjacencies
We also utilize our flagship brands to sell branded products in adjacent packaged food categories. In order to address the growing shift in demand for sugar alternatives, we have introduced new products in the chocolate, jams, cereal bars, and chocolate chip and bake mix categories under our well-known tabletop sweetener brands. These products benefit from strong brand recognition in selected geographies and the ability for customers to easily identify them as low-sugar alternatives when making purchasing decisions.
Other Brands and Products
In addition to our flagship brands of tabletop sweeteners and branded adjacency products, we also utilize several local brands in specific countries. We believe that these locally-targeted brands have better brand awareness in those countries than our international flagship brands, providing a differentiated product offering in those markets.
Flavors & Ingredients
Flavors & Ingredients, comprised of our Mafco Worldwide division of operating companies, is a global, business-to-business focused operation with a long history as a trusted supplier of essential, functional ingredients to some of the CPG industry’s largest and most demanding customers. Our products provide a variety of solutions for our customers, including flavoring enhancement, flavor / aftertaste masking, moisturizing, product mouthfeel modification and skin soothing characteristics. Our Flavors & Ingredients segment operates as our licorice-derived products business.
Founded in 1850, Mafco Worldwide has been the leading global manufacturer and supplier of licorice derivative and extract products, primarily serving beverage, confectionary, cosmetic, food, nutritional, pharmaceutical, personal care and tobacco end markets. Mafco Worldwide’s ability to reliably deliver a consistent, highly customized, superior product has been at the core of its longevity and long-term customer relationships.
As of December 31, 2022, we sell over 200 customer-specific licorice products, consistently meeting taste, chemical, physical, microbiological and regulatory demands, specifications and standards. Our ability to deliver this breadth of products is due to our extensive knowledge and experience with the raw material sourcing and manufacturing processes. This is further supported by our industry-leading supply security and availability, which consists of best-in-class supply chain capabilities, long-standing relationships with key raw material suppliers, and maintenance of substantial raw material reserve inventory around the world.
Our Flavors & Ingredients products are sold across two types of end product: Derivative Products and Extract Products.
Derivative Products are functional ingredients based on a unique compound found only in licorice root, glycyrrhizic acid, which are used in a variety of food, beverage, pharmaceutical, personal care, cosmetic, and nutritional products around the world. In food, beverage and pharmaceutical products, licorice derivatives are used to provide flavor, mask undesirable tastes and extend and intensify sweetness and other flavors. In personal care and cosmetics products, licorice derivatives are used to moisturize, soothe topical skin conditions, and brighten and smooth skin. We sell derivative products both in a line of proprietary compound flavors under the Magnasweet® brand as well as in their pure isolated form.
Magnasweet® and our latest, Magna-Branded products are our proprietary line of functional taste modulators, which have highly-enhanced characteristics and specific uses compared to the pure derivatives themselves. The backbone ingredient in Magnasweet® and Magna-Branded products are our pure licorice derivatives, as well as proprietary blends of flavoring and other food ingredients. All Magnasweet® and Magna-Branded product ingredients are GRAS (“Generally Recognized As Safe”) by the U.S. Food and Drug Administration (“FDA”) and/or the Flavor and Extract Manufacturers Association (“FEMA”), and are regulated by the FDA under 21 CFR 184.1408. The base licorice derived component compounds are generally classified as “natural” in Mafco Worldwide’s largest end markets and are also categorized as Non-GMO and Non-Allergenic, thereby they are a “clean label” ingredient.
Extract Products are a concentrated form of the water extracted solids from the raw licorice root which are converted into powder, semi-fluid or blocks, depending on the customer’s requirements and are used in a variety of tobacco, alcohol and confectionary products around the world. In tobacco products, licorice extracts are used as flavor enhancing and moistening agents in the manufacture of American Blend® cigarettes, moist snuff, and chewing and pipe tobacco. In confectionary products, licorice extract is used as flavoring for licorice confections.
Growth Strategies
Our platform can be leveraged to support new product development, distribution gains in North America, further geographic expansion and to pursue mergers and acquisitions (“M&A”) activity. We will seek to expand our branded products platform through investment opportunities in the natural alternatives and clean label categories across the global consumer products industry. Over time, we will look to become a portfolio of brands that Open a World of Goodness™ to consumers and their families.
Recent product launches across various geographical markets have been well-received by consumers, and we believe that sales of new products will continue to have a positive impact on revenue going forward. We are able to adapt to changing market conditions, and our management team has identified opportunities for continued research and development, and expansion of product offerings as consumer preferences shift towards natural products.
We believe that there is a large opportunity for growth in North America and that we have benefited from contacts and relationships, increasing distribution in the natural retailer channel, innovation and reinvestment of cash flow. These efforts are intended to drive retailer support and engagement with club stores and regional grocers to help increase distribution of our new products.
Additionally, we continue to pursue continued growth in developing economies and gaining entrance into new geographies. Sugar-related health problems are becoming a critical concern to governments and populations in developing economies as diabetes and obesity rates rise. Our management team believes that the need for solutions, together with rising incomes in these geographies, represent macro tailwinds driving local consumers to seek alternatives to sugar. Positive consumption and awareness trends are driving sweetener penetration rates and expanding the category in these countries. Moreover, consumer affinity for developed economy brands such as Equal® and Canderel® position them as premier products. We focus on accelerating brand-building, innovation and marketplace execution in geographies where Equal® and Canderel® are considered premier brands.
In the Latin America and Asia Pacific regions, adoption of our original products was strong in 2022. In addition, we expect to have significant new opportunities for growth in India and China. We believe that we are under-penetrated in these two large markets and that our management team can help drive increased distribution.
Furthermore, our management team and board of directors have significant experience in executing and integrating M&A transactions and view targeted tuck-in M&A as a core part of our value creation strategy. Our officers and directors maintain a robust list of potentially actionable acquisition opportunities across end markets to build scale, strengthen market position, enter new geographies globally, and expand into new product verticals. These potential targets cover both the Branded CPG and Flavors & Ingredients segments and include companies in a variety of sizes and geographies.
Marketing and Distribution Channels
Branded CPG
Recent marketing focus has been on identifying global and local consumer preferences, utilizing research & development (“R&D”) to co-develop a new pipeline of products, and driving brand-building initiatives by leveraging digital, television, and in-store campaigns. In addition to in-house resources, we utilize agencies and experts in the areas of advertising, brand-building, packaging, and in-store promotion / merchandising.
We distribute Branded CPG products in the United States and internationally through a variety of distribution channels including supermarket, grocery, drugstore, mass, club, food-service, e-commerce, and through distributors and brokers. This distribution strategy enables our products to reach a wide variety of customer types at multiple points of sale and consumption. In addition, we are able to leverage our existing distribution channels and relationships to sell incremental products to those customers.
We sell our CPG products principally across six geographic regions: North America, Europe, India, Middle East and Africa (“IMEA”), Asia Pacific, and Latin America.
Flavors & Ingredients
All Flavors & Ingredients sales in the United States are made through our offices located in Mount Laurel, New Jersey and Richmond, Virginia, with technical support from our Flavors & Ingredients R&D department. Outside the United States, we sell our Flavors & Ingredients products from our Mount Laurel, New Jersey office, through our French and Chinese subsidiaries and through exclusive agents as well as independent distributors.
Marketing activity is conducted through our website, digital marketing strategy, tradeshows, R&D newsletters, and email campaigns to effectively reach the individuals who will make purchase to product development decisions at our customers at the R&D, procurement, and the executive levels.
Suppliers, Raw Materials and Procurement
Branded CPG
The primary raw materials used in our Branded CPG manufacturing processes are stevia leaf extract, monk fruit extract, erythritol, allulose, aspartame, sucralose, saccharin, organic sugar, organic honey, and dextrose. Packaging material used in the manufacturing process includes paper, shipping boxes, glass jars, cartons, stand-up pouches, and plastic bottles. Key ingredients are procured and available on a global scale. These ingredients are contracted forward, with additional supply available in all key markets.
We believe we maintain excellent relationships with our Branded CPG suppliers and are not reliant on any one vendor for critical supply.
Flavors & Ingredients
The licorice root used to produce the products sold by our Flavors & Ingredients segment originates in the Middle East and Central Asia in countries such as Afghanistan, the Peoples’ Republic of China, Pakistan, Iraq, Azerbaijan, Kazakhstan, Turkmenistan, Uzbekistan, Tajikistan, Georgia, Armenia, Russia and Turkey. Our strategy of maintaining strong relationships across multiple markets and suppliers allows us to seamlessly source our licorice raw material requirements in the event supply from any one area or supplier becomes temporarily unavailable or uneconomical.
We have an exclusive supply contract to purchase the output of licorice extract and certain licorice derivatives from a manufacturer with facilities in Central Asia. For the year ended December 31, 2022, our purchases from this supplier totaled approximately $9.1 million, representing 23.4% of our licorice raw material purchases for the year. In addition to a stable source of licorice raw material, we strive to maintain sufficient licorice raw material inventory and open purchase contracts to meet normal production needs for one or more years to overcome the natural variability in wild collected licorice root quality from various regions and crop cycles and ensure against temporary disruptions in supply.
Our licorice manufacturing and raw material sourcing process is also uniquely flexible in that we are able to use multiple types of commercially available licorice raw material including roots, intermediate licorice extracts and licorice derivatives produced by third parties. This manufacturing and raw material sourcing flexibility enables us to maximize the value of our raw material purchases and inventory investments and to respond quickly to new business opportunities by utilizing intermediate raw material.
International Operations
We are a global company with sales in over 100 countries, and our principal markets outside the U.S. are in Europe, Asia, the Middle East, Africa and Latin America. Management has identified significant opportunities for increasing the customer base via geographic expansion, distribution gains and product innovation. Our geographic diversity allows us to draw on the skills of a worldwide workforce, provides greater stability to our operations, allows us to drive economies of scale, provides sales streams that may help offset economic trends that are specific to individual economies and offers us an opportunity to access new markets for products. Our management team has strong global relationships with many customers and channels, including grocery, club stores, distributors and food service operators across a number of key geographies that accelerates new product placement and will help us expand our presence in currently under-penetrated markets, such as India and China. In addition, we believe that our future growth depends in part on our ability to continue developing products and sales models that successfully target high-growth markets.
In 2022, we generated approximately 66% of our revenue in North America, approximately 17% of our revenue in Europe, approximately 10% of our revenue in Asia Pacific, approximately 4% of our revenue in IMEA and approximately 3% of our revenue in Latin America. In 2022, one customer accounted for more than 10% of our total sales, representing 14.1% of total sales. One customer accounted for more than 10% of total sales in 2021, but no single customer accounted for more than 10% of total sales in 2020.
The manner in which our products and services are sold outside the U.S. differs by business and by region. Most of our sales in non-U.S. markets are made by our subsidiaries located outside the U.S., though we also sell directly from the U.S. into non-U.S. markets through various representatives and distributors and, in some cases, directly. In countries with low sales volumes, we generally sell through representatives and distributors.
Information about the effects of foreign currency fluctuations on our business is set forth in “Management’s Discussion and Analysis of Financial Condition and Results of Operations.” For a discussion of risks related to our non-U.S. operations and foreign currency exchange, please refer to the section entitled “Risk Factors - Risks Related to Our Business.”
Research & Development
We have dedicated R&D teams employed at each of our reportable business segments. R&D efforts are divided across geographies and focus on a number of areas including new product launches, formulation development, and product expansion opportunities. Our R&D capabilities include supporting existing and potential customers on projects with our products, education on proper use of the products through demonstrations, newsletters, and tradeshows, application development and new product development.
Intellectual Property
Our ability to create, obtain and protect intellectual property (“IP”) is important to the success of our business and our ability to compete. We create IP in our operations globally, and we work to protect and enforce our IP rights. We consider our trademarks valuable assets, including well-known trademarks such as Whole Earth®, Wholesome®, Swerve®, Equal®, Canderel®, Pure Via® and Magnasweet®.
In addition, we integrate licensed third-party technology and IP into certain aspects of our products.
Although certain third-party proprietary IP rights are important to our success, we do not believe we are materially dependent on any particular third-party patent, license, or group.
Competition
We believe that we are a leader in many of our served markets. Although our businesses generally operate in highly competitive markets, our competitive position cannot be determined accurately in the aggregate or by segment, since none of our competitors offer all of the same product and service lines or serve all of the same markets as we do. Because of the range of the products and services we sell and the variety of markets we serve, we encounter a wide variety of competitors, including well-established regional competitors and competitors who are more specialized than we are in particular markets.
Key competitive factors vary among our businesses and product and service lines, but include the specific factors noted above with respect to each segment and typically also include price, quality, performance, delivery speed, applications expertise, distribution channel access, service and support, technology and innovation, breadth of product, service and brand name recognition.
We believe that the principal competitive factors in distributing tabletop sweeteners are product taste, consumer brand recognition, ingredient preference, and price. The low-calorie tabletop sweetener market is currently well served at a variety of price points by a number of well-established competitors. We believe that the entrance of a new competitor using existing sweetening ingredients would find it challenging to overcome a highly loyal consumer base, established relationships with worldwide trade and distribution networks, the expense of brand building and lack of product differentiation. As such, we have experienced very little new competition within the alternative sweetener market globally.
The functional ingredients market typically consists of ingredients that account for a small amount of the customer’s cost of sales, but are vitally important to functionality. Within this market, the principal competitive factors for the licorice category include supply security and availability, product quality, proprietary formulations, price, and technical support. Our Flavors & Ingredients segment is uniquely positioned given its global footprint, best-in-class supply chain capabilities, proprietary manufacturing processes, and regulatory approved customer formulations that reliably provide customers with critical ingredients for their products. Our Flavors & Ingredients segment competes globally for certain derivative products against divisions of larger flavor houses and chemical companies and we compete in local markets with a number of small, private, typically country-focused manufacturers, brokers, and distributors.
Regulation and Compliance
As a food and ingredient manufacturer, we operate in compliance with the requirements of the FDA and other regional food manufacturing guidelines. Our products comply with the U.S. Federal Food, Drug and Cosmetic Act of 1938 and the rules and regulations promulgated thereunder, state unfair competition and deceptive trade practices statutes, Food Allergen Labeling and Consumer Protection Act of 2004, the Organic Foods Production Act, and all comparable state and international laws and each of their applicable implementing regulations.
Licorice extract and certain pure licorice derivatives used as additives are GRAS for use in food by the FDA. Global approval for the use of licorice extract and derivatives for food consumption varies depending upon the country. Pure licorice derivatives have been successfully utilized in approved pharmaceutical and cosmetics products around the world. Pure licorice derivatives are also approved for use under the EU Cosmetic Directive and by the U.S. Cosmetic Ingredient Review Board.
Our primary Flavors & Ingredients international manufacturing facilities are currently Global Food Safety Initiative (“GFSI”)-certified and all facilities are registered with the FDA. Each manufacturing facility is monitored using coordinated quality departments located in the U.S., France and China to ensure that all product shipped is in compliance with quality and regulatory requirements. In addition to food manufacturing regulations, we operate in compliance with OSHA requirements and with applicable federal, state, local and international environmental laws and regulations. Safety training programs are maintained at each facility to educate employees on food safety and workplace safety requirements.
The Family Smoking Prevention and Tobacco Control Act of 2009 (“TCA”) gave the FDA comprehensive authority to regulate the manufacturing, marketing and sale of tobacco products in the U.S. The TCA requires tobacco companies to disclose the contents of tobacco products and any changes to their products, and requires FDA review and approval of all new tobacco products. Among its broad powers, the FDA may order changes in cigarettes and other existing tobacco products to meet new product standards based on medical, scientific and other technological evidence as appropriate for the protection of the public health. We work with our tobacco customers to ensure compliance with applicable FDA standards and regulations.
Human Capital Resources
Whole Earth Brands is a global company, with approximately 760 employees operating in 15 countries. Our employees are engaged in a number of key functions, including operations, sales, R&D and administration. Approximately 38% of our employees are based in North America and approximately 62% of our employees are based outside of North America. The vast majority of our employees work full-time, with approximately 57% working at global production facilities and others working at office locations or R&D facilities.
Our employees create our success, and below are some of the human capital components that enable our employees.
Mission, Vision and Values
At Whole Earth Brands, our vision is to help people enjoy life’s everyday moments and the celebrations that bring us together. As part of our quest to make this vision a reality, we collectively work as a team to execute on our mission of enabling healthier lifestyles and providing access to high-quality plant-based sweeteners, flavor enhancers and other foods through our diverse portfolio of trusted brands and delicious products. All of this work is supported by a talented, dedicated team, energized by our vision, and united in our core values of accountability, agility, passion, and integrity.
Diversity, Equity and Inclusion
We believe that everyone should be welcomed, encouraged, and respected at Whole Earth Brands. By living our core values every day, we create an environment where the diverse backgrounds and experiences of our employees enable us to thrive. Globally, approximately 52% of our employees are men and approximately 48% of our employees are women.
Employee Health and Safety
The safety and well-being of our employees is of utmost importance. We train our employees on workplace safety, including how to follow our written safety standards and procedures, the law pertaining to workplace safety, and how to watch for and report anything potentially harmful.
To ensure that Whole Earth Brands employees and their families in every country in which we operate have access to free support and resources for topics related to their health and well-being, we provide our employees with a global employee assistance program at no cost to them.
Total Rewards
In addition to the importance we place on the health, satisfaction and security of our employees and their families, our ability to attract and retain a workforce with the skills critical to our business operations is equally important. We provide a total rewards package that offers valuable and market competitive compensation and benefit plans. These programs reflect our commitment to attracting and retaining top talent, and keeping our employees and their families healthy and secure. Our compensation philosophy is to pay for performance, and we do so through short-term and long-term incentives, all tied to business performance.
Given our diverse employee base with needs that are unique to each individual, we offer benefits that can be selected by each employee to best meet his or her needs. Our benefits vary by region, but generally include medical, dental and vision insurance, retirement savings accounts, disability insurance and other voluntary benefits. We also offer time-off benefits which are equally important to the well-being of our employees including vacation time, sick leave, company paid holidays, and parental leave. We have also introduced a hybrid work model for office based employees to assist with balancing work and personal life.
Environmental, Social and Governance
Our Environmental, Social and Governance (“ESG”) initiatives are intended to enable our business to have a positive impact across product development, ingredient sourcing, manufacturing, and hiring. Our ESG priorities center on three pillars: advance sustainably, support thriving workers and communities, and enable healthier lifestyles. We have developed certain measurable targets in order to guide our ESG efforts with respect to (i) climate; (ii) packaging; (iii) waste and water; (iv) responsible sourcing; (v) diversity, equity and inclusion; (vi) innovation and transparency; and (vii) equitable access.
Corporate Information
Our principal executive offices are located at 125 S. Wacker Drive, Suite 1250, Chicago, IL 60606, and our telephone number is (312) 840-6000. We maintain a website at www.wholeeearthbrands.com. The information contained on our website is not intended to form a part of, or be incorporated by reference into, this Annual Report on Form 10-K.
Available Information
Access to all of our SEC filings, including our Annual Report on Form 10-K, quarterly reports on Form 10-Q, current reports on Form 8-K, and amendments to those reports filed or furnished pursuant to Section 13(a) or 15(d) of the Exchange Act, is provided, free of charge, on our website (www.wholeearthbrands.com) as soon as reasonably practicable after such reports are electronically filed with, or furnished to, the SEC. Additionally, the SEC maintains an internet site (www.sec.gov) that contains reports, proxy and information statements, and other information regarding issuers that file electronically with the SEC.
Item 1A. Risk Factors.
You should consider carefully all of the following risk factors and all the other information contained in this report, including the financial statements. If any of the following risks occur, our business, financial condition or results of operations may be materially and adversely affected. In that event, the trading price of our securities could decline, and you could lose all or part of your investment. The risk factors described below are not necessarily exhaustive and you are encouraged to perform your own investigation with respect to us and our business.
Risks Related to Our Branded CPG Segment
Rapid growth of natural sweetener products may not be sustainable and launches of new products may not be successful.
The rapid net sales growth experienced in our natural sweetener category may not be sustainable long term and could moderate in the coming years or quarters. In addition, adoption of the Whole Earth®, Pure Via®, Wholesome® and Swerve® brands may be slower or cost more than has been historically experienced. New sweeteners may be introduced into the market which could impact net sales growth and our competitors with substantially greater resources than us may be more responsive to changes within the industry and be better equipped to introduce new products more quickly.
We must expend resources to maintain consumer awareness of our brands, build brand loyalty and generate interest in our products. Our marketing strategies and channels will evolve and our programs may or may not be successful.
We believe that our consumer-packaged goods are broadly known and followed in the United States and many other countries in which we operate. In order to remain competitive, keep shelf placement for our products and expand, we may need to increase our marketing and advertising spending to maintain and increase consumer awareness, protect and grow our existing market share or promote new products, which could affect our operating results. Substantial advertising and promotional expenditures may be required to maintain or improve our brands’ market positions or to introduce new products to the market, we and other participants in our industry are increasingly engaging with non-traditional media, including consumer outreach through social media and web-based channels, which may not prove successful. An increase in our marketing and advertising efforts may not maintain our current reputation, or lead to increased brand awareness. In addition, we consistently evaluate our product lines to determine whether or not to discontinue certain products. Discontinuing product lines may increase our profitability but could reduce our sales and hurt our brands, and a reduction in sales of certain products could result in a reduction in sales of other products. The discontinuation of product lines may have an adverse effect on our business, financial condition and results of operations.
Health-related allegations could damage consumer confidence in our products.
Periodically, claims are made regarding the safety of artificial sweeteners consumption. Past claims include allegations that artificial sweeteners lead to various health problems. Although we believe that we have been successful in presenting scientific evidence to dispute these claims and restore consumer confidence in the face of each of these claims, there can be no assurance that we will be similarly successful if health-related allegations are made in the future. If consumers lose confidence in the safety of our products, regardless of the accuracy or ability to support such claims, our sales and margins would be negatively impacted. Furthermore, actions by the FDA and other federal, state or local agencies or governments, domestically or abroad, may impact the acceptability of or access to certain sweeteners. For example, the FDA could ban or recall certain sweeteners for safety reasons.
Product liability claims or product recalls could adversely affect our business reputation.
The sale of food products for human consumption involves the risk of injury to consumers. Such hazards could result from:
•tampering by unauthorized third parties;
•product contamination;
•the presence of foreign objects, substances, chemicals and other agents; or
•residues introduced during the manufacturing, packaging, storage, handling or transportation phases.
Some of the products we sell are produced for us by third parties and such third parties may not have adequate quality control standards to ensure that such products are not adulterated, misbranded, contaminated or otherwise defective. Any of the above circumstances could necessitate a voluntary or mandatory recall, a need to change a product’s labeling or other consumer safety concerns. Any widespread product recall, whether voluntary or mandatory, may result in significant loss due to the costs of a recall, related legal claims, including claims arising from bodily injury or illness caused by our products, the destruction of product inventory, lost sales due to product unavailability, or unfavorable change in customer sentiment of our products. In addition, we license our brands for use on products produced and marketed by third parties, for which we receive royalties. We, as well as the manufacturers of our products, may be subject to claims made by consumers as a result of products manufactured by these third parties which are marketed under our brand names.
Consumption of adulterated products may cause serious health-related illnesses and we may be subject to claims or lawsuits relating to such matters. Even an inadvertent shipment of adulterated products is a violation of law and may lead to an increased risk of exposure to product liability claims, product recalls and increased scrutiny by federal and state regulatory agencies. Such claims or liabilities may not be covered by our insurance or by any rights of indemnity or contribution which we may have against third parties. In addition, even if a product liability claim is not successful or is not fully pursued, the negative publicity surrounding any assertion that our products caused illness or injury could have a material adverse effect on our reputation with existing and potential consumers and on our brand image, all of which could negatively impact our earnings and cash flows.
Our Branded CPG segment may be adversely affected by concentration in our manufacturer, supplier and distributor base.
We currently rely upon external manufacturers in the U.S., as well as internal manufacturing in the Czech Republic and Decatur, Alabama, a number of key tollers, external manufacturers, packaging suppliers, ingredient suppliers, and 3PL (logistics) vendors globally. There are a limited number of manufacturing service suppliers, ingredient and packaging suppliers with the capability and capacity to meet our strict product requirements effectively. Failure by our external manufacturers, internal plants, ingredients or packaging suppliers to manufacture or supply, as applicable, or our logistics vendors to transport our products, in accordance with our agreements with each supplier could result in inventory shortages. Our manufacturer, supplier, and distributor base may be adversely affected by factors beyond our control. Higher prices for natural gas, propane, electricity and other fuels may also increase our ingredient, production and delivery costs. Inventory practices and redundant sourcing contingencies have been established in the event of protracted product supply interruptions; however, regulatory, manufacturing, and replenishment lead times for contingent sources could extend beyond safety stock coverage, which would negatively impact earnings and cash flows and impair our ability to operate our business.
Additionally, we use exclusive distributors in certain jurisdictions for our products. Our Branded CPG segment would suffer disruption if these distributors were to fail to perform their expected services or to effectively represent us, which could adversely affect our business.
Risks Related to Our Flavors & Ingredients Segment
Our business is heavily dependent on sales to the worldwide tobacco industry, and negative developments and trends within the tobacco industry could have a material adverse effect on our business, financial condition and results of operations.
In 2022, approximately 31.3% of our Flavors & Ingredients sales and 6.7% of our consolidated net revenues were to the worldwide tobacco industry for use as tobacco flavor enhancing and moistening agents in the manufacture of American blend cigarettes, moist snuff, chewing tobacco and pipe tobacco. Changing public attitudes toward tobacco products, an increased emphasis on the public health aspects of tobacco product consumption, increases in excise and other taxes on tobacco products and an expansion of tobacco regulations in a number of countries have contributed significantly to a worldwide decline in consumption. Continued negative developments and trends within the tobacco industry could have a material adverse effect on our Flavors & Ingredients business, financial condition and results of operations.
Additionally, the tobacco industry has been subject to increased governmental taxation and regulation and in recent years has been subject to substantial litigation and these trends are likely to continue and will likely negatively affect tobacco product consumption and tobacco product manufacturers.
Producers of tobacco products are subject to regulation in the United States at the federal, state and local levels, as well as in foreign countries. The FDA has the power to limit the type or quantity of additives that may be used in the manufacture of tobacco products in the United States. This power has been extended to include e-cigarettes and other electronic nicotine delivery systems (“ENDS”). Actions by the FDA and other federal, state or local agencies or governments may impact the acceptability of or access to tobacco products, limit consumer choice as to tobacco products, delay or prevent the launch of new or modified tobacco products, require the recall or other removal of tobacco products from the marketplace (for example, as a result of product contamination, rulemaking that bans menthol, a determination by the FDA that one or more tobacco products do not satisfy the statutory requirements for substantial equivalence, because the FDA requires that a currently-marketed tobacco product proceed through the pre-market review process or because the FDA otherwise determines that removal is necessary for the protection of public health), restrict communications to tobacco consumers, restrict the ability to differentiate tobacco products, or otherwise significantly increase the cost of doing business, or restrict or prevent the use of specified tobacco products in certain locations or the sale of tobacco products by certain retail establishments. For example, in 2020, the FDA issued a statement effectively banning certain unauthorized ENDS products containing flavors other than
tobacco or menthol which had previously constituted a significant percentage of the overall revenues of that category. Similarly, in April 2022, the FDA proposed a rule that would ban all characterizing flavors (other than tobacco) in cigars and cigarillos within the next year.
Similarly, countries outside the United States have rules restricting the use of various ingredients in tobacco products. During 2005, the World Health Organization promulgated its Framework Convention for Tobacco Control (the “FCTC”). The FCTC is the first international public health treaty and establishes a global agenda for tobacco regulation in order to limit the use of tobacco products. More than 160 countries, as well as the European Union, have become parties to the FCTC. In November 2010, the governing body of the FCTC issued guidelines that provide non-binding recommendations to restrict or ban flavorings and additives that increase the attractiveness of tobacco products and require tobacco product manufacturers to disclose ingredient information to public health authorities who would then determine whether such ingredients increase attractiveness. Future tobacco product regulations may be influenced by these FCTC recommendations. The European Union and individual governments are also considering regulations to further restrict or ban various cigarette ingredients. For example, pursuant to the Tobacco Products Directive (“TPD”), a directive of the European Union that places limits on the sale and merchandising of tobacco and tobacco related products in member countries, European Union regulators are currently evaluating the health effects of 15 ingredients, including licorice, used in tobacco products.
Over the years, there has been substantial litigation between tobacco product manufacturers and individuals, various governmental units and private health care providers regarding increased medical expenditures and losses allegedly caused by use of tobacco products. Some of this litigation has been settled through the payment of substantial amounts to various state governments, and United States cigarette companies significantly increased the wholesale price of cigarettes in order to recoup a portion of the settlement cost. Cigarette companies have also sought to offset the cost of these payments by changing product formulations and introducing new products with decreased ingredient costs. There may be an increase in health-related litigation against the tobacco industry, and it is possible that Mafco Worldwide, as a supplier to the tobacco industry, may become a party to such litigation. Such litigation, if successful, could have a material adverse effect on our Flavors & Ingredients business.
The tobacco business, including the sale of cigarettes and smokeless tobacco, has been subject to federal, state, local and foreign excise taxes for many years. In recent years, federal, state, local and foreign governments have increased such taxes as a means of both raising revenue and discouraging the consumption of tobacco products. New proposals to increase taxes on tobacco products are also regularly introduced in the United States and foreign countries. Additional taxes may lead to an accelerated decline in tobacco product sales. Tax increases are expected to continue to have an adverse impact on sales of tobacco products through lower consumption levels.
We are unable to predict whether there will be additional price or tax increases for tobacco products or the size of any such increases, or the effect of other developments in tobacco regulation or litigation or consumer attitudes on further declines in the consumption of either tobacco products containing licorice extract or on sales of licorice extract to the tobacco industry. Further material declines in sales to the tobacco industry are likely to have a significant negative effect on the financial performance of our Flavors & Ingredients business.
Changes in, or interpretations of, regulations regarding licorice or its components may reduce our sales and profits.
Restrictions on certain licorice components vary worldwide, as countries, or states may have varying limits on specific components. Regulations issued by state, federal and foreign governments and agencies and any modification to interpretation and/or enforcement of those regulations, may impact the potential markets for our Flavors & Ingredients products. As further research is conducted on raw materials and testing technology and capabilities increase, additional items may be identified within the natural licorice matrix which may be a source for limitation of application of our Flavors & Ingredients products.
Our Flavors & Ingredients products are currently marketed as natural flavors in the U.S. and other major markets. As the definition of “natural” varies throughout the world, changes in worldwide governmental regulatory agency definitions of natural may impact the potential market for our Flavors & Ingredients products.
European Union regulators are currently evaluating the health effects of 15 ingredients, including licorice, used in tobacco products pursuant to the Tobacco Products Directive (“TPD”), a directive that places limits on the sale and merchandising of tobacco and tobacco related products in member countries. An adverse recommendation by the European Union to reduce or eliminate the use of licorice in cigarettes sold in the European Union would have a negative impact on our revenues and operations in Europe. While the European Union has not enacted any new rules or regulations regarding the inclusion of licorice as an additive in cigarettes, in recent years, our sales of licorice to be used in tobacco products to be sold in Europe have declined.
Changes in our relationships with our suppliers could have a material adverse effect on our Flavors & Ingredients business, financial condition and results of operations.
We operate a complex supply chain which is critical to our Flavors & Ingredients operations. In the event of disruption, we may face operational risk that could result in carrying inadequate supplies to meet our customer demand. If we are unable to manage our supply chain efficiently, our operating costs could increase and our profit margins could decrease.
Our Flavors & Ingredients business is dependent on our relationships with suppliers of licorice raw materials (which includes licorice root, intermediary licorice extract and licorice derivatives). The licorice raw materials we purchase originate in Afghanistan, the Peoples’ Republic of China, Pakistan, Iraq, Azerbaijan, Uzbekistan, Turkmenistan, Kazakhstan, Tajikistan, Georgia, Armenia, Russia and Turkey. During 2022, one of our suppliers of licorice raw materials supplied approximately 23.4% of our total licorice raw materials purchases. We have an exclusive supply arrangement with a manufacturer of licorice extract and crude derivatives in Central Asia. The agreement expires in October 2025 and gives us the right to purchase all of the licorice products manufactured at the facility. Although alternative sources of licorice raw materials are available to us, we could incur higher costs if the supplier is unable to produce sufficient quantities of licorice raw materials at the quality levels required. If any material licorice raw materials supplier modifies its relationship with us, such a loss, reduction or modification could have a material adverse effect on our Flavors & Ingredients business, results of operations and financial condition.
Fluctuations in costs of licorice root and intermediary licorice extract could have a material adverse effect on our Flavors & Ingredients business, financial condition and results of operations.
The price of licorice raw materials was generally stable, except for higher transportation costs in 2022. The price of licorice raw materials is affected by many factors, including monetary fluctuations and economic, political and weather conditions, natural or man-made disasters, consumer demand and changes in governmental trade or agriculture programs in countries where our flavors and ingredients suppliers are located. Although we often enter into purchase contracts for these products, significant or prolonged increases in the prices of licorice raw materials could have a material adverse effect on our Flavors & Ingredients business, results of operations and financial condition.
We are subject to risks associated with economic or political instability in countries in which we source licorice root and intermediary licorice extract.
We purchase licorice raw materials from various suppliers including in Afghanistan, the People’s Republic of China, Pakistan, Iraq, Azerbaijan, Uzbekistan, Turkmenistan, Kazakhstan, Tajikistan, Georgia, Armenia, Russia and Turkey. These countries and regions have, from time-to-time, been subject to political instability, corruption and violence. Producers of intermediary licorice extract are located primarily in the People’s Republic of China, Iraq and Central Asia. Our wholly-owned derivative manufacturing facilities, the primary source of our licorice derivatives, are located in the People’s Republic of China. Economic or political instability, government intervention or civil unrest in these countries and regions could have a material adverse effect on our Flavors & Ingredients business, results of operations and financial condition. In response to the ongoing military conflict between Russia and Ukraine, the United States and European Union imposed a number of sanctions and export control restrictions on Russia that continue to evolve. Furthermore, military action as well as continuing threats of terrorist attacks and unrest, have caused instability in the world’s financial and commercial markets and have significantly increased political and economic instability in some of the countries and regions from which our raw materials originate. Acts of terrorism and threats of armed conflicts in or around these countries and regions could adversely affect our Flavors & Ingredients business, results of operations and financial condition in ways we cannot predict at this time.
Any failure to maintain the quality of our manufacturing processes or raw materials could harm our operating results.
The manufacture of our Flavors & Ingredients products is a multi-stage process that requires the use of high-quality materials and manufacturing technologies. We are dependent on our suppliers to provide licorice raw materials meeting our quality standards. In spite of stringent quality controls, weaknesses in process control or minute impurities in materials may cause a substantial percentage of a product in a lot to be defective. If we were not able to maintain our manufacturing processes or stringent quality controls, or if contamination problems arise, the operating results of our Flavors & Ingredients business would be harmed.
Our Flavors & Ingredients segment is subject to risks related to weather, disease and pests that could adversely affect our business.
Licorice production is subject to a variety of agricultural risks. Extreme weather conditions, disease and pests can materially and adversely affect the quality and quantity of licorice produced. We maintain large inventories of raw material stock as part of our operating plan. The stability of licorice raw materials is dependent upon the ability of the product to remain dry and free of infestation. Increased governmental restrictions on the application of pesticides or fumigants could reduce our ability to maintain long-term storage of licorice root or result in increased cost of operations. A sustained supply interruption could have a material adverse effect on our Flavors & Ingredients business, results of operations and financial condition.
Our failure to accurately forecast and manage inventory could result in an unexpected shortfall of our Flavors & Ingredients products, which could harm our business.
We monitor our inventory levels based on our own projections of future demand. Because of the length of the supply chain cycle and the time necessary to produce licorice products, we must make production decisions well in advance of sales. However, we may not accurately forecast demand and an inaccurate forecast of demand can result in the unavailability of licorice products that may otherwise be in high demand. This unavailability may negatively impact sales volumes and adversely affect customer relationships. Furthermore, from time to time, changes in manufacturing processes or in customer demand may cause certain inventory to become obsolete or require substantial reserves.
The imposition of tariffs by the United States and other countries could have a material adverse effect on our Flavors & Ingredients business, financial condition and results of operations.
We import licorice raw materials from various countries and export products from the U.S., France and China. The imposition of tariffs by a country from which we import goods or to which we export goods could result in increased costs of production and higher prices and reduced demand for our Flavors & Ingredients products.
Risks Related to Our Business
Industry competition, consolidation and costs may reduce sales and margins.
We operate in a highly competitive industry and compete with companies that have greater capital resources, facilities and diversity of product lines. Increased competition for products could result in decreased demand for our products and, reduced volumes and/or prices, each of which would reduce our sales and margins and have a material adverse effect on our business, financial condition and results of operations.
Our Flavors & Ingredients customers are under pressure to reduce costs, which could cause them to reformulate their products and substitute cheaper ingredients for our products. The ingredients industry is also undergoing consolidation. Consolidation may enable our customers to negotiate lower prices for our Flavors & Ingredients products. These customer and industry pressures may result in lower sales of our Flavors & Ingredients products and/or lower margins on our Flavors & Ingredients sales.
With respect to our Branded CPG segment, our competitors might also introduce new low-calorie sweeteners and other alternatives to sugar. To the extent that current users of our Branded CPG products switch to other low-calorie sweeteners or sugar alternatives, there could be a decrease in the demand for our products. In addition, competitors with larger marketing budgets can influence consumer preferences. There is no assurance that Branded CPG’s existing marketing spending is sufficient to stay competitive with other product manufacturers.
Our margins are also under pressure from consolidation in the retail food industry in many regions of the world. In the United States, we have experienced a shift in the channels where consumers purchase our products from the higher margin retail to the lower margin club and mass merchandisers. Additionally, increased competition from private label manufacturers of low-calorie tabletop sweeteners may have a negative impact on sales and/or margins. Consolidation within the industry we operate may significantly increase our cost of doing business and may further result in lower sales of our products and/or lower margins on sales.
Additionally, the success of our Branded CPG segment depends in part on our ability to manage costs and be efficient in the highly competitive tabletop sweetener industry. Inability to manage fluctuations in the price and availability of raw materials, energy, freight and other operating inputs could contribute to decreased profitability. Such fluctuations could stem from alternative crops and varying local or regional harvests because of, for example, weather conditions, crop disease, climate change, product scarcity, or crop yields. In some cases, we may not be able to pass the full increase in raw material prices, or higher energy, freight or other operating costs, on to our customers.
Climate change, or legal or market measures to address climate change, may negatively affect our business and operations.
There is growing concern that a gradual rise in global average temperatures due to increased concentration of carbon dioxide and other greenhouse gases in the atmosphere will cause significant changes in weather patterns around the globe, and increase the frequency, severity, and duration of extreme weather conditions and natural disasters, and water scarcity and poor water quality. These events could adversely impact the manufacturing or delivery of raw materials required for our products, disrupt the operation of our supply chain and the productivity of our contract manufacturers, increase our production costs, impose capacity restraints and impact the purchases of our products and services.
In many countries, governmental bodies are proposing and enacting new or additional legislation and regulations to address the potential impacts of climate change, including, among other regulations, the Corporate Sustainability Reporting Directive (“CSRD”) adopted by the European Parliament in November 2022 (which requires us to report detailed information on climate and other ESG-related matters in the coming years), the European Union’s proposed Corporate Sustainability Due Diligence Directive and the SEC’s proposed climate change rules. If we, our suppliers or others in our value chain, are required to comply with these laws and regulations in the future, or if we choose to take voluntary steps to reduce or mitigate our impact on climate change, we may experience increased costs for compliance, reporting, supply chain management and due diligence, energy, production, transportation, and raw materials, increased capital expenditures, or increased insurance premiums and deductibles, which could adversely impact our operations. Additionally, we use natural gas, diesel, fuel, gasoline, propane, electricity and other fossil fuel-based resources in our operations, all of which could face increased regulation and increased prices as a result of climate change or other environmental concerns. Inconsistency of legislation and regulations among jurisdictions may also affect the costs of compliance with such laws and regulations. Any assessment of the effects of climate change, potential impact of future climate change legislation, regulations or industry standards, as well as any international treaties and accords, is uncertain given the wide scope of potential regulatory change in the countries in which we operate and could negatively affect our business, financial condition, results of operations and cash flows.
Our failure to adequately address sustainability and ESG concerns of stakeholders or respond to changing ESG regulations may harm our reputation and have a material adverse impact on our business.
Governmental authorities, non-governmental organizations, customers, investors, external stakeholders and employees are increasingly sensitive to sustainability and ESG concerns, such as diversity and inclusion, climate change, water use, recyclability or recoverability of packaging, and plastic waste. In addition, governments and the public expect companies like us to take responsibility for and report on compliance with various human rights, responsible sourcing and environmental practices, as well as other actions of our third-party contractors around the world. This focus on ESG concerns and changing regulation, such as the CSRD, may lead to new requirements that could result in increased costs associated with developing, manufacturing and distributing our products and increased costs associated with compliance and reporting. Moreover, the standards by which ESG matters are measured are developing and evolving, and certain areas are subject to assumptions that could change over time. A variety of organizations measure performance on ESG topics, including on topics such as the cost, even if unintended, of our actions on climate change and inequality in society. Our ability to compete could also be affected by changing customer preferences and requirements, such as growing demand for more environmentally friendly products, packaging or supplier practices, and by failure to meet such customer expectations or demand. While we strive to improve our ESG performance, we risk negative stockholder reaction, including from proxy advisory services, as well as damage to our brand and reputation, if we do not act responsibly, or if we are perceived to not be acting responsibly in key ESG areas, including environmental stewardship, product safety and quality, sustainable sourcing and packaging, support for local communities, diversity and inclusion, corporate governance and transparency, and addressing workers’ rights, or if our business changes in a manner that requires us to change our sustainability and ESG goals. Additionally, failure to achieve our publicly-disclosed sustainability and ESG goals or targets, or to meet the ESG expectations of our investors, employees, customers, ESG ratings agencies and other stakeholders, could negatively impact our reputation, hinder our access to capital, lead to reduced demand for our products, loss of customers, “greenwashing” and other claims, and other negative impacts on our business and results of operations.
We are currently operating in a period of economic uncertainty and capital markets disruption, which has been the result of various global macro-economic factors including the ongoing military conflict between Russia and Ukraine and inflationary pressures. Our business, financial condition, and results of operations may be materially adversely affected by conditions in the countries where we operate, the negative impact on the global economy, supply chain and capital markets resulting from the conflict in Ukraine, any other geopolitical tensions, or inflationary pressures.
We operate in many countries throughout the world. Economic and political changes in the countries where we market and produce our products, such as inflation rates, recession, foreign ownership restrictions, restrictions on transfer of funds into or out of a country and similar factors may adversely affect our results of operations. U.S. and global markets continue to experience volatility and disruption in connection with the geopolitical tensions and the ongoing military conflict between Russia and Ukraine. In February 2022, Russian troops began a full-scale military invasion of Ukraine. Although the length and impact of the ongoing military conflict is highly unpredictable, the conflict in Ukraine has contributed to market disruptions, including significant volatility in commodity prices, higher interest rates and debt capital costs, diminished liquidity and credit availability, volatile capital markets, declines in consumer confidence and discretionary spending, as well as supply chain interruptions and increases in costs of certain raw materials and transportation, all of which have contributed to inflationary pressures globally. We are continuing to monitor inflation, the situation in Ukraine and global capital markets and assessing its potential impact on our business.
Although, to date, our business has not been materially impacted by the ongoing military conflict between Russian and
Ukraine, geopolitical tensions, or resulting market disruptions, it is impossible to predict the extent to which our operations will be impacted in the short and long term, or the ways in which such matters may impact our business since the extent and duration of these matters are unpredictable. The geopolitical instability arising from such conflict, the imposition of sanctions, taxes and/or tariffs against Russia and Russia’s response to such sanctions (including retaliatory acts, such as cyber-attacks and sanctions against other countries) has contributed to volatility in the global economy or specific international, regional and domestic markets, which could have a material adverse effect on our business, results of operations or financial condition. The imposition of tariffs by the United States and other countries could have a material adverse effect on our businesses, financial condition and operations.
The ongoing novel coronavirus (COVID-19) outbreak has presented many challenges to our business and any future new travel and other restrictions may disrupt our business, including among other things, impacting our supply chain, and driving change in customer and consumer demand for our products.
The COVID-19 pandemic and responses thereto continue to create challenging and unprecedented conditions, including as infection rates and new variants continue to evolve.
Our business could in the future be, negatively impacted by decreases in disposable income, and declines in consumer confidence could cause a decrease in demand for our overall product set, particularly higher priced products; reduced workforce due to illness or restrictions related to communicable disease; the development and availability of effective treatments and vaccines for new variants; a shortage of qualified labor to support increased demand; any failure to make our products available to consumers by our manufacturing employees or third parties on which we rely, including but not limited to our suppliers, contract manufacturers, distributors, logistics providers and other business partners, and retailers that ultimately sell our Branded CPG products to consumers and customers of our Flavors & Ingredients business. The impact of, and associated responses to, the COVID-19 pandemic may have an adverse effect on other aspects of our business and operations. For example, we may incur increased costs or face operational challenges, including: increased manufacturing costs or decreased manufacturing capacity; increases in the costs, or reductions in the availability of timely delivery of, ingredients, packaging and other materials used in the manufacture of our products; increased labor costs; and other increased operating costs.
While we have experienced a net increase in the overall demand for our products during the COVID-19 pandemic, any of the foregoing factors, or other effects of the pandemic that are not currently foreseeable, could materially increase our costs, negatively impact our sales and damage our, financial condition, results of operations, cash flows and liquidity position. Our efforts to manage and mitigate these factors may be unsuccessful, and the effectiveness of these efforts to a certain extent depends on many factors beyond our control.
If we fail to successfully implement our growth strategies on a timely basis, or at all, our ability to increase our revenue and operating profits could be materially and adversely affected.
Our future success depends, in large part, on our ability to implement our growth strategies effectively. Our ability to successfully expand our consumer packaged goods and ingredients brands and other growth strategies depends on, among other things, our ability to identify, and successfully cater to, new demographics and consumer trends, develop new and innovative products, identify and acquire additional product lines and businesses, secure shelf space in grocery stores, wholesale clubs and other retailers, increase consumer awareness of our brands, enter into distribution and other strategic arrangements with third-party retailers and other potential distributors of our products, and compete with numerous other companies and products. We may not be successful in reaching and maintaining the loyalty of new consumers to the same extent, or at all, as we have with our historical consumers. If we are unable to identify and capture new audiences and demographics, our ability to successfully integrate additional brands will be adversely affected. Accordingly, we may not be able to successfully implement our growth strategies, expand our brands, or continue to maintain growth in our sales at our current rate, or at all. If we fail to implement our growth strategies or if we invest resources in growth strategies that ultimately prove unsuccessful, our sales and profitability may be negatively affected, which would materially and adversely affect our business, financial condition and results of operations.
Changes in consumer preferences could decrease our revenues and cash flow.
We are subject to the risks of evolving consumer preferences and nutritional and health-related concerns. To the extent that consumer preferences evolve away from low-calorie sweeteners, there will be a decreased demand for some of our Branded CPG products. Consumer perception that there are low-calorie tabletop and baking sweetener alternatives that are healthier or more natural could decrease demand for such products. Any shift in consumer preferences away from our Branded CPG products, including any shift in preferences from aspartame-based products, stevia leaf extract, monk fruit extract, allulose, erythritol, and organic nutritive sweeteners to other nutritive and low-calorie sweetener products could significantly decrease our revenues and cash flows and impair our ability to operate our Branded CPG business segment.
A portion of our Flavors & Ingredients revenues are derived from the sale of licorice to worldwide confectioners. To the extent that consumer preferences shift away from licorice-flavored candy, operating results relating to the sale of licorice to worldwide confectioners could be impaired, which could have a material adverse effect on our business, financial condition and results of operations. In addition, a portion of our revenues are derived from the sale of licorice derivatives to food processors for use as flavoring or masking agents. To the extent that consumer preferences evolve away from products that use licorice derivatives, operating results relating to the sale of licorice derivatives could be impaired, which could have a material adverse effect on our business, financial condition and results of operations.
We are heavily dependent on certain customers for a significant percentage of our net revenues.
The loss of or disruptions related to significant customers could result in a material reduction in sales or change in the mix of products we sell to a significant customer. In 2022, our top five Branded CPG customers accounted for approximately 31.6% of our Branded CPG net revenues. In 2022, our ten largest Flavors & Ingredients customers, three of which are manufacturers of tobacco products, accounted for approximately 56.1% of our Flavors & Ingredients net revenues. There can be no assurance that our customers will continue to purchase our products in the same mix or quantities or on the same terms as in the past. This could materially and adversely affect our product sales, financial condition and results of operations.
Our Business is subject to transportation risks.
Our ability to obtain adequate and reasonably priced methods of transportation to distribute our products is a key factor to our success. Delays in transportation including weather-related delays, carrier capacity limitations, and extended interruptions could have a material adverse effect on our Branded CPG and our Flavors & Ingredients segments, financial condition and results of operations. Further, higher fuel costs and increased line haul costs due to industry capacity constraints, customer delivery requirements and a more restrictive regulatory environment could also negatively impact our financial results. We cannot be sure that we would be able to transport or distribute our products by alternative means if it were to experience an interruption due to strike, natural disasters, epidemics or pandemics, political conflict, civil unrest or otherwise, in a timely and cost-effective manner.
Negative information, including inaccurate information, about us on social media may harm our reputation and brand, which could have a material and adverse effect on our business, financial condition and results of operations.
There has been a marked increase in the use of social media platforms and similar channels that provide individuals with access to a broad audience of consumers and other interested persons. The availability of information on social media platforms is virtually immediate, as is its effect. Many social media platforms immediately publish the content their subscribers and participants post, often without filters or checks on accuracy of the content posted. The opportunity for dissemination of information, including inaccurate information, is potentially limitless and may result in increased scrutiny by consumers, third parties, the media, governments, stockholders and other stakeholders. Information concerning our business and/or products, including public health concerns, illness, safety, security breaches of confidential consumer or employee information, employee related claims relating to alleged employment discrimination, health care and benefit issues or government or industry findings about our retailers, distributors, manufacturers or others across the industry supply chain may be posted on such platforms at any time. Negative views regarding our products and the efficacy of our products have been posted on various social media platforms, may continue to be posted in the future, and are outside of our control. Regardless of their accuracy or authenticity, such information and views may be adverse to our interests and may harm our reputation and brand. The harm may be immediate without affording an opportunity for redress or correction. Ultimately, the risks associated with any such negative publicity cannot be eliminated or completely mitigated and may materially and adversely affect our business, financial condition and results of operations.
The full effects of the United Kingdom’s withdrawal from the European Union remain uncertain and continue to evolve, which could have an adverse impact on our business, financial condition, operating results and cash flows.
We have operations in the U.K. related to our Branded CPG segment. Brexit has created and may continue to create legal, political and economic risks and uncertainties for these U.K. operations.
Further changes resulting from Brexit could therefore subject our Branded CPG segment to increased risk for the foreseeable future. These risks include changes in regulatory oversight, disruptions to trade and supply, increases in prices, fees, taxes or tariffs on goods that are sold between the E.U. and the U.K. and difficulty staffing. Additionally, Brexit may cause fluctuations in the value of the U.K. pound sterling and E.U. euro.
Our international operations involve the use of foreign currencies, which subjects us to exchange rate fluctuations and other currency risks.
The revenues and expenses of our international operations generally are denominated in local currencies, which subject us to exchange rate fluctuations between such local currencies and the U.S. dollar. These exchange rate fluctuations subject us to currency translation risk with respect to the reported results of our international operations, as well as to other risks sometimes associated with international operations. In the future, we could experience fluctuations in financial results from our operations outside of the United States, and there can be no assurance we will be able, contractually or otherwise, to reduce the currency risks associated with our international operations.
Inability to protect our trademarks and other proprietary rights could damage our competitive position.
Any infringement or misappropriation of our intellectual property could damage its value, dilute the value of our brand
in the marketplace and limit our ability to compete. We rely on copyrights, trademarks, trade secrets, confidentiality provisions and licensing arrangements to establish and protect our intellectual property. We may have to engage in litigation to protect our rights to our intellectual property, which could result in significant litigation costs and require significant amounts of management’s time. One or more adverse judgments with respect to these intellectual property rights could
negatively impact our ability to compete and could adversely affect our results of operations and financial condition.
We believe that the formulas and blends for our products are trade secrets. We rely on security procedures and confidentiality agreements to protect this proprietary information; however, such agreements and security procedures may be insufficient to keep others from acquiring this information. Any such dissemination or misappropriation of this information could deprive us of the value of our proprietary information.
Further, the laws of some countries do not protect proprietary rights to the same extent as the laws of the United States, and mechanisms for enforcement of intellectual property rights in some foreign countries may be inadequate. To the extent we expand our international activities, our exposure to unauthorized copying and use of our technologies and proprietary information may increase. Accordingly, despite our efforts, we may be unable to prevent third parties from infringing upon, misappropriating or otherwise violating our technology and intellectual property.
If we fail to comply with the many laws applicable to our business, we may incur significant fines and penalties.
Our facilities and products are subject to laws and regulations administered by the FDA, and other federal, state, local, and foreign governmental agencies relating to the processing, packaging, storage, distribution, advertising, labeling, quality, and safety of food products. Our failure to comply with applicable laws and regulations could subject us to administrative penalties and injunctive relief, civil remedies, including fines, injunctions and recalls of our products. Our operations are also subject to regulations administered by the Environmental Protection Agency and other state, local and foreign governmental agencies. Failure to comply with these regulations can have serious consequences, including civil and administrative penalties and negative publicity. Any environmental or health and safety legislation or regulations enacted in the future, or any changes in how existing or future laws or regulations are enforced, administered or interpreted, as well as any material cost incurred in connection with liabilities or claims from these regulations may lead to an increase in costs, which could have a material adverse effect on our business, our consolidated financial condition, results of operations and/or liquidity.
Personal data, including personal data of our customers and employees, is increasingly subject to legal and regulatory protections around the world, which vary widely in approach. We risk exposure to potential liabilities and costs resulting from the compliance with, or any failure to comply with, applicable legal requirements. Our business could be materially adversely affected by our inability, or the inability of our vendors who receive personal data from us, to comply with legal obligations regarding the use of personal data.
In addition to the possible fines and penalties discussed above, changes in laws and regulations in domestic and foreign jurisdictions, including changes in food and drug laws, accounting standards, taxation requirements (including tax rate changes, new tax laws and revised tax law interpretations) and environmental laws could have a significant adverse effect on our results of operations.
The countries in which we operate and from which we purchase raw materials could result in exposure to liability under the Foreign Corrupt Practices Act or under regulations promulgated by OFAC. Our failure to comply with applicable laws and regulations could subject us to administrative penalties and injunctive relief, civil remedies, including fines, injunctions and product recalls. The complexity of the many laws and regulations applicable to our business and the cost of compliance increases our costs of operations compared to some foreign competitors which are subject to less regulation.
Any acquisitions, partnerships or joint ventures that we enter into could disrupt our operations and have a material adverse effect on our business, financial condition and results of operations.
From time to time, we may evaluate potential strategic acquisitions of businesses, including partnerships or joint ventures with third parties. We may not be successful in identifying acquisition, partnership and joint venture candidates. In addition, we may not be able to continue the operational success of such businesses or successfully finance or integrate any businesses that we acquire or with which we form a partnership or joint venture. We may have potential write-offs of acquired assets and/or an impairment of any goodwill recorded as a result of acquisitions. Furthermore, the integration of any acquisition may divert management’s time and resources from our core business and disrupt our operations or may result in conflicts with our business. Any acquisition, partnership or joint venture may not be successful, may reduce our cash reserves, may negatively affect our earnings and financial performance and, to the extent financed with the proceeds of debt, may increase our indebtedness. We cannot ensure that any acquisition, partnership or joint venture we make will not have a material adverse effect on our business, financial condition and results of operations.
We may become involved in litigation that may materially adversely affect us.
From time to time, we may become involved in various legal proceedings relating to matters incidental to the ordinary course of our business, including intellectual property, commercial, product liability, employment, class action, whistleblower and other litigation and claims, and governmental and other regulatory investigations and proceedings. Such matters can be time-consuming, divert management’s attention and resources, cause us to incur significant expenses or liability or require us to change our business practices. Because of the potential risks, expenses and uncertainties of litigation, we may, from time to time, settle disputes, even where we believe that we have meritorious claims or defenses. Because litigation is inherently unpredictable, we cannot give any assurance that the results of any of these actions will not have a material adverse effect on our business.
Changes in tax laws or regulations may increase tax uncertainty and adversely affect results of our operations and our effective tax rate.
We are subject to taxes in the United States and certain foreign jurisdictions. Due to economic and political conditions, tax rates in various jurisdictions, including the United States, may be subject to change. Our future effective tax rates could be affected by changes in the mix of earnings in countries with differing statutory tax rates, changes in the valuation of deferred tax assets and liabilities and changes in tax laws or their interpretation. In addition, we may be subject to income tax audits by various tax jurisdictions. Although we believe our income tax liabilities are reasonably estimated and accounted for in accordance with applicable laws and principles, an adverse resolution by one or more taxing authorities could have a material impact on the results of our operations.
We may be exposed to the threat of cyber-attacks and/or data breaches.
Cybersecurity breaches of our or third-party systems, may cause confidential information belonging to us or our employees, customers, consumers, partners, suppliers, or governmental or regulatory authorities to be misused or breached. When risks such as these materialize, the need for us to coordinate with various third-party service providers and for third party service providers to coordinate amongst themselves, might increase challenges and costs to resolve related issues.
Cyber-attacks can vary in scope and intent from economically driven attacks to malicious attacks targeting our key operating systems with the intent to disrupt, disable or otherwise cripple our Branded CPG and Flavors & Ingredients segments. This can include any combination of phishing attacks, malware and/or viruses targeted at our key systems. The breadth and scope of this threat has grown over time, and the techniques and sophistication used to conduct cyber-attacks, as well as the sources and targets of the attacks, change frequently. While we invest time, effort and capital resources to secure our key systems and networks, we cannot provide assurance that we will be successful in preventing or responding to all such attacks.
If we are subject to a successful cyber-attack, we may suffer damage to our key systems and/or data that could interrupt our operations, adversely impact our reputation and brands and expose us to increased risks of governmental investigation, litigation and other liability, any of which could adversely affect our business. Furthermore, responding to such an attack and mitigating the risk of future attacks could result in additional operating and capital costs in systems technology, personnel, monitoring and other investments.
Our success significantly depends on key personnel.
Our performance significantly depends upon the continued contributions of our executive officers and key employees, both individually and as a group, and our ability to retain and motivate them. Our officers and key personnel have many years of experience in our industry and it may be difficult to replace them. If we lose key personnel or are unable to recruit qualified personnel, our business, financial condition and results of operations may be adversely affected.
Risks Related to Our Capital Structure
Our substantial indebtedness could adversely affect our financial condition and we may incur additional debt.
In connection with the closing of the Wholesome Transaction on February 5, 2021, we entered into an amendment and restatement agreement (as amended pursuant to that certain First Amendment to Amended and Restated Loan Agreement,
dated June 15, 2022) which amended and restated our existing senior secured loan agreement dated June 25, 2020, as amended on September 4, 2020 (as discussed under “Management’s Discussion and Analysis of Financial Condition and Results of Operations”). The total indebtedness under the credit facility as of December 31, 2022 was $435.9 million, net of unamortized discounts. The obligations under our credit facilities are guaranteed by certain direct or indirect wholly-owned domestic subsidiaries of ours. Our credit facilities are secured by substantially all of our personal property and the guarantor subsidiaries (in each case, subject to certain exclusions and qualifications).
We are also permitted, under the terms of our credit facilities, to incur additional indebtedness, both under our credit facilities and otherwise. If such additional indebtedness is incurred, we may exacerbate the risks of our indebtedness described herein.
Our existing substantial indebtedness and any future indebtedness, if incurred, could:
•require us to dedicate a substantial portion of cash flow from operations to payments in respect of our indebtedness, instead of funding working capital, capital expenditures, potential acquisition opportunities, a level of marketing necessary to maintain the current level of sales and other general corporate purposes;
•increase the amount of interest that we have to pay, because our borrowings are at variable rates of interest, which will result in higher interest payments if interest rates increase, and, if and when we are required to refinance any of our indebtedness, an increase in interest rates would also result in higher interest costs;
•increase our vulnerability to adverse general economic or industry conditions;
•require refinancing, which we may not be able to do on reasonable terms;
•limit our flexibility in planning for, or reacting to, competition and/or changes in our business or the industry in which we operate;
•limit our ability to borrow additional funds;
•restrict us from making strategic acquisitions or necessary divestitures, introducing new brands and/or products or exploiting business opportunities; and
•place us at a competitive disadvantage compared to our competitors that have less debt and/or more financial resources.
Our ability to meet expenses and debt service obligations will depend on our future performance, which will be affected by financial, business, economic and other factors, potential changes in consumer and customer preferences and behaviors, the success of product and marketing innovation and pressure competitors. If we do not generate enough cash to pay our debt service obligations, we may be required to refinance all or part of our existing debt, sell assets, reduce or delay capital expenditures, borrow more money or issue additional equity.
Our credit facilities contain financial and other covenants. The failure to comply with such covenants could have an adverse effect.
Our credit facilities contain certain financial and other covenants, and limitations on our and our subsidiaries’ ability to, among other things, incur additional indebtedness and make guarantees; incur liens on assets; engage in mergers or consolidations, dissolutions or other fundamental changes; sell assets; pay dividends and distributions or other restricted payments or repurchase stock; make investments, loans and advances, including acquisitions; amend organizational documents or other material agreements; enter into certain agreements that would restrict our and our subsidiaries’ ability to pay dividends; repay certain junior, unsecured or subordinated indebtedness; issue certain equity; engage in certain activities; and engage in certain transactions with affiliates, in each case, subject to customary exceptions materially consistent with credit facilities of such type and size. Any failure to comply with the restrictions of our credit facilities may result in an event of default under the credit facilities. Our contemplated credit facilities bear interest at variable rates. If market interest rates increase, variable rate debt will create higher debt service requirements, which could adversely affect our cash flow.
Risks Related to Ownership of Our Securities
The price of our common stock and warrants may be volatile.
The trading price of our common stock as well as our warrants may fluctuate due to a variety of factors, regardless of our operating performance, including:
•changes in the industries in which we and our customers operate, including developments involving our competitors;
•variations in our operating performance and the performance of our competitors in general;
•actual or anticipated fluctuations in our quarterly or annual operating results;
•publication of research reports by securities analysts about us or our competitors or our industry;
•the public’s reaction to our press releases, our other public announcements and our filings with the SEC;
•additions and departures of key personnel;
•changes in laws and regulations affecting our business;
•commencement of, or involvement in, litigation involving the combined company;
•changes in our capital structure, such as future issuances of securities or the incurrence of additional debt;
•the volume of shares of our common stock available for public sale; and
•general economic and political conditions such as recessions, interest rates, fuel prices, international currency fluctuations, corruption, political instability and acts of war or terrorism.
In the past, securities class-action litigation has often been instituted against companies following periods of volatility in the market price of their shares. This type of litigation could result in substantial costs and divert our management’s attention and resources, which could have a material adverse effect on us.
If we do not maintain effective internal control over financial reporting, we may not be able to accurately report our financial results in a timely manner or prevent fraud, which may adversely affect investor confidence in our financial reporting and adversely affect our business and operating results and the market price for our common stock.
Effective internal control over financial reporting is necessary for us to provide reliable financial reports. In the future, we may discover areas of our internal control over financial reporting that need improvement. If we fail to properly and efficiently maintain an effective internal control over financial reporting, we could fail to report our financial results accurately. Effective internal controls are necessary for us to provide reliable financial reports and prevent fraud.
We previously identified a material weakness in our controls over the accounting for warrants. Based on the views expressed in the SEC’s Staff Statement of April 12, 2021 in which the SEC staff clarified its interpretations of certain generally accepted accounting principles related to certain terms common in warrants issued by special purpose acquisition companies, we determined that the Private Warrants should be treated as derivative liabilities rather than as components of equity, as previously presented. We determined that our controls to evaluate the accounting for complex financial instruments, such as the issuance of warrants, did not operate effectively to appropriately apply the provisions of ASC 815-40. This material weakness did not result in a material error in our accounting for warrants; however, it was determined that there was a reasonable possibility that the error could have resulted in a material amount. Based on our assessment, management concluded that, as of March 31, 2021 and June 30, 2021, our internal control over financial reporting was not effective. As of September 30, 2021, management concluded that the material weakness was remediated.
We may identify new material weaknesses in the future, which could limit our ability to prevent or detect a material
misstatement of our annual or interim financial statements. The occurrence of, or failure to remediate, a material weakness
could result in our failure to maintain compliance with legal requirements, including Section 404 of the Sarbanes-Oxley Act
and rules regarding timely filing of periodic reports, in addition to applicable stock exchange listing requirements, which
could cause investors to lose confidence in our financial reporting and could have an adverse effect on the market price of our
common stock.
Our Private Warrants are accounted for as liabilities and changes in the value of these warrants could have a material effect on our financial results.
At each reporting period, the fair value of the warrant liabilities for the Private Warrants will be re-measured and the change in the fair value of the liability will be recorded as other income (expense) in our statement of operations. Changes in the inputs and assumptions for the valuation model we use to determine the fair value of such liability may have a material impact on the estimated fair value of the derivative liability. The share price of our common stock represents the primary underlying variable that impacts the value of the derivative instruments. Additional factors that impact the value of the derivative instruments include the volatility of our stock price and publicly traded warrants and interest rates. As a result, our consolidated financial statements and results of operations will fluctuate quarterly, based on various factors, such as the share price of our common stock, many of which are outside of our control. In addition, we may change the underlying assumptions used in our valuation model, which could result in significant fluctuations in our results of operations. If our stock price is volatile, we expect that we will recognize non-cash gains or losses on the Private Warrants each reporting period and that the amount of such gains or losses could be material. The impact of changes in fair value on earnings may have an adverse effect on the market price of our common stock.
Risks Related to the Business Combination
We may have tax consequences and other liabilities as a result of the Business Combination.
We cannot provide assurance that the due diligence conducted in relation to Merisant and MAFCO identified all material issues or risks associated with the Branded CPG or Flavors & Ingredients business or the industry in which they compete. Furthermore, we cannot provide assurance that factors outside of our control will not later arise. As a result of these factors, we may be exposed to liabilities and incur additional costs and expenses and we may be forced to later write-down or write-off assets, restructure our operations, or incur impairment or other charges that could result in us reporting losses. Even if our due diligence had identified certain risks, unexpected risks may arise and previously known risks may materialize in a manner not consistent with our preliminary risk analysis, and we may not successfully integrate or achieve anticipated benefits and synergies of the Business Combination. If any of these risks materialize, they could have a material adverse effect on our financial condition and results of operations and could contribute to negative market perceptions about us or our securities.
As a result of the Business Combination, we inherited the historic liabilities of Merisant and MAFCO, including their historic tax liabilities. To the extent that there is any liability for historic tax exposure of any of the companies acquired through the Business Combination, this exposure can impact the value of our securities. Such exposure could also impact our tax liability for future years. As a part of the Business Combination, we have negotiated certain indemnities for historic tax liabilities, however, these indemnities do not cover all potential historical tax liabilities.
The historical financial results of Merisant and MAFCO may not be indicative of what our actual financial position or results of operations would have been.
The historical financial results of Merisant and MAFCO included in this Annual Report on Form 10-K do not reflect the financial condition, results of operations or cash flows they would have achieved as a standalone company during the periods presented or those we will achieve in the future. For example, we have incurred, and will continue to incur, additional ongoing costs as a result of the Business Combination, including costs related to public company reporting, investor relations and compliance with the Sarbanes-Oxley Act. Therefore, it may be difficult for investors to compare our future results to historical results or to evaluate our relative performance or trends in our segments.
Item 1B. Unresolved Staff Comments.
None.
Item 2. Properties.
As of December 31, 2022, our facilities included 30 office, manufacturing, warehousing and administration facilities. Fifteen of these facilities are located in the United States in eight states, and the remaining locations are outside the U.S., primarily in Europe and Asia and, to a lesser extent, in Latin America and the Middle East. These facilities cover approximately 1,445,000 square feet, of which approximately 223,000 square feet are owned and 1,222,000 square feet are leased.
We produce a majority of our Branded CPG products at production facilities that we currently operate in Teplice, Czech Republic and Decatur, Alabama and at various external manufacturers throughout the world. We produce our Flavors & Ingredients products at production facilities we currently own or operate in Richmond, Virginia, Zhangjiagang, China, Shanghai, China, Gardanne, France and Camden, New Jersey.
We believe that our facilities are adequate to meet our needs for the immediate future and that suitable additional space will be available to accommodate any expansion of our operations as needed.
We currently maintain our principal executive offices at 125 S. Wacker Drive, Suite 1250, Chicago, IL 60606, and our telephone number is (312) 840-6000.
Item 3. Legal Proceedings.
We are from time to time subject to various claims, lawsuits and other legal and administrative proceedings arising in the ordinary course of business. Some of these claims, lawsuits and other proceedings may involve highly complex issues that are subject to substantial uncertainties, and could result in damages, fines, penalties, non-monetary sanctions or relief. However, we do not consider any such claims, lawsuits or proceedings that are currently pending, individually or in the aggregate, to be material to our business or likely to result in a material adverse effect on our future operating results, financial condition or cash flows.
Item 4. Mine Safety Disclosures.
Not applicable.
PART II
Item 5. Market for Registrant’s Common Equity, Related Stockholder Matters and Issuer Purchases of Equity Securities.
Market Information
Our Common Stock, with a par value of $0.0001 per share, is traded on The NASDAQ Stock Market LLC (“NASDAQ”) under the symbol “FREE”.
Holders
On March 10, 2023, there were approximately 15 holders of record of our Common Stock, which does not include the number of persons whose stock is in nominee or “street” name accounts through brokers.
Securities Authorized for Issuance Under Equity Compensation Plans
See Part III, Item 12 for information regarding securities authorized for issuance under our equity compensation plans.
Recent Sales of Unregistered Securities
None.
Purchases of Equity Securities by the Issuer and Affiliated Purchasers
On September 8, 2020, the Company announced that its board of directors had authorized a stock repurchase plan of up to $20 million of shares of the Company’s common stock. The shares were available for repurchase from time to time over a 12-month period which expired on September 15, 2021, in open market transactions at prevailing market prices, in privately negotiated transactions, or by other means in accordance with U.S. federal securities laws. There were no repurchases of the Company’s common stock under the stock repurchase plan.
Performance Graph
The following stock performance graph compares the cumulative total return of our common stock since it began trading on the NASDAQ on June 25, 2020 through December 31, 2022 with the cumulative total return of the S&P 500 Index and the S&P 1500 Packaged Foods & Meats Index. The graph assumes the value of the investment in our common stock and each index was $100 on June 25, 2020 and assumes reinvestment of any dividends. The stock price performance below is not necessarily indicative of future stock price performance.
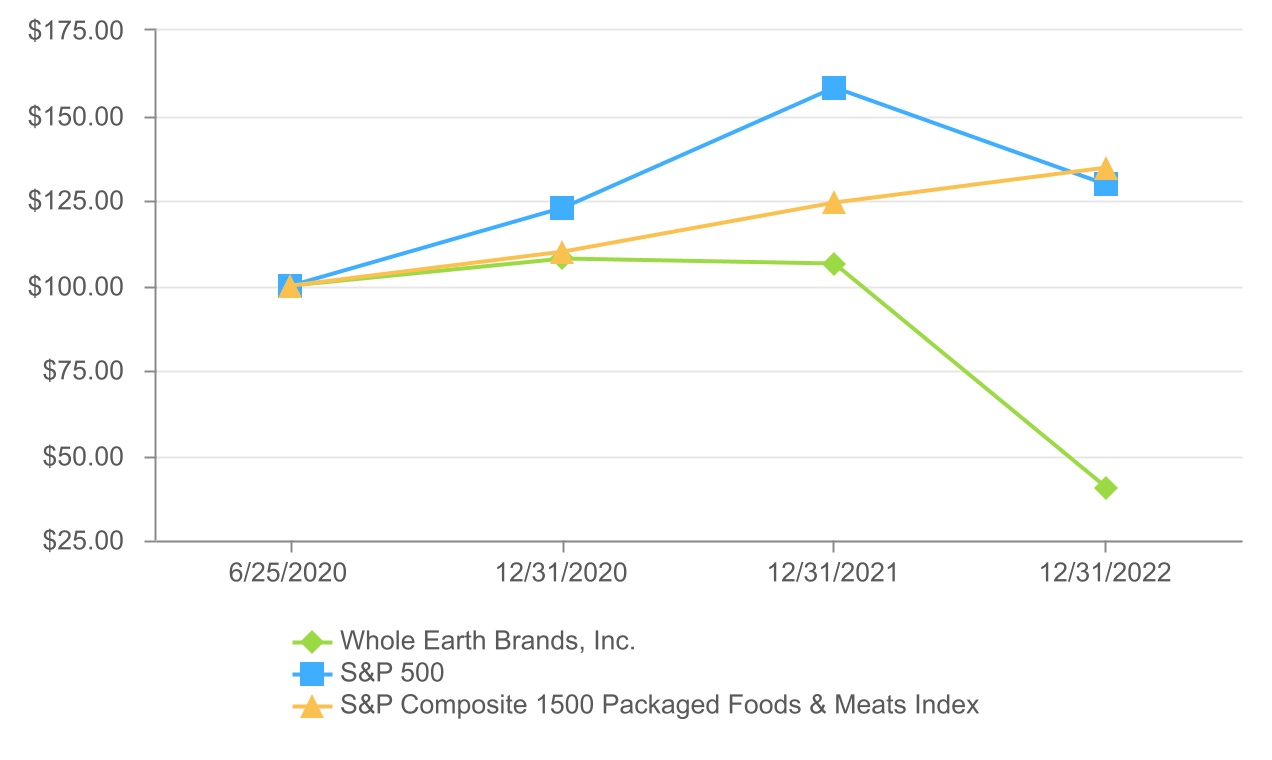
| | | | | | | | | | | | | | | | | | | | | | | | | | |
| Company Name / Index | | June 25, 2020 | | December 31, 2020 | | December 31, 2021 | | December 31, 2022 |
| Whole Earth Brands, Inc. | | $ | 100.00 | | | $ | 107.92 | | | $ | 106.34 | | | $ | 40.30 | |
| S&P 500 | | $ | 100.00 | | | $ | 122.84 | | | $ | 158.11 | | | $ | 129.47 | |
| S&P Composite 1500 Packaged Foods & Meats Index | | $ | 100.00 | | | $ | 110.00 | | | $ | 124.34 | | | $ | 134.50 | |
Item 6. Reserved.
Item 7. Management’s Discussion and Analysis of Financial Condition and Results of Operations.
The following discussion and analysis should be read in conjunction with the other sections of this Annual Report on Form 10-K, including “Item 1. Business,” and our audited consolidated and combined financial statements and notes thereto. For purposes of this section, “Whole Earth Brands,” the “Company,” “we,” or “our” refer to (i) Mafco Worldwide & Merisant and their subsidiaries (“Predecessor”) for the period from January 1, 2020 through June 25, 2020 (referred to herein as a “Predecessor Period”) prior to the consummation of the Business Combination and (ii) Whole Earth Brands, Inc. and its subsidiaries (the “Successor”) for the period from June 26, 2020 through December 30, 2020 and the years ended December 31, 2021 and 2022 (the “Successor Period”) after the consummation of the Business Combination, unless the context otherwise requires.
This Management’s Discussion and Analysis of Financial Condition and Results of Operations contains a number of forward looking statements, all of which are based on our current expectations and could be affected by the uncertainties and other factors described throughout this Annual Report on Form 10-K and particularly in “Item 1A. Risk Factors” and “Cautionary Note Regarding Forward-Looking Statements.”
Overview
We are a global food company enabling healthier lifestyles and providing access to high-quality plant-based sweeteners, flavor enhancers and other foods through our diverse portfolio of trusted brands and delicious products. We operate a proven platform organized into two reportable segments.
•Branded CPG, comprised of our Merisant division of operating companies, Wholesome and Swerve, is a global CPG business focused on building a branded portfolio oriented toward serving consumers seeking better-for-you sweeteners across the zero calorie, plant-based, organic, non GMO, and Fair Trade spaces in zero/low calorie sweeteners, honey, agave baking mix, and baking chocolate segments. Our Branded CPG products are sold under both our flagship brands, as well as local and private label brands. Our flagship brands include Whole Earth®, Pure Via®, Wholesome®, Swerve®, Canderel®, Equal® and existing branded adjacencies.
•Flavors & Ingredients, comprised of our Mafco Worldwide division of operating companies, is a global, business-to-business focused operation with a long history as a trusted supplier of essential, functional ingredients to some of the CPG industry’s largest and most demanding customers. Our products provide a variety of solutions for our customers, including flavoring enhancement, flavor / aftertaste masking, moisturizing, product mouthfeel modification and skin soothing characteristics. Our Flavors & Ingredients segment operates as our licorice-derived products business.
Significant Acquisitions
On June 24, 2020, we domesticated into a Delaware corporation and changed our name from “Act II Global Acquisition Corp.” to “Whole Earth Brands, Inc.” On June 25, 2020, we consummated the Business Combination of (i) all of the issued and outstanding equity interests of Merisant Company, Merisant Luxembourg Sarl (“Merisant Luxembourg”), Mafco Worldwide LLC, Mafco Shanghai LLC (“Mafco Shanghai”), EVD Holdings LLC (“EVD Holdings”), and Mafco Deutschland GmbH (together with Merisant Company, Merisant Luxembourg, Mafco Worldwide LLC, Mafco Shanghai, and EVD Holdings, and their respective direct and indirect subsidiaries, “Merisant and Mafco Worldwide”), and (ii) certain assets and liabilities of Merisant and Mafco Worldwide included in the Transferred Assets and Liabilities (as defined in the Purchase Agreement (as hereafter defined)), from Flavors Holdings Inc. (“Flavors Holdings”), MW Holdings I LLC (“MW Holdings I”), MW Holdings III LLC (“MW Holdings III”), and Mafco Foreign Holdings, Inc. (“Mafco Foreign Holdings,”) and together with Flavors Holdings, MW Holdings I, and MW Holdings III, the “Sellers”), pursuant to that certain Purchase Agreement (the “Purchase Agreement”) entered into with the Sellers dated as of December 19, 2019, as amended.
As a result of the Business Combination, Act II was deemed to be the acquirer for accounting purposes, and Merisant and MAFCO, which is the business conducted prior to the closing of the Business Combination, was deemed to be the acquiree and accounting Predecessor. The Business Combination was accounted for as a business combination using the acquisition method of accounting, and the Successor’s financial statements reflect a new basis of accounting that is based on the fair value of net assets acquired. As a result of the application of the acquisition method of accounting as of the effective time of the Business Combination, the financial statements for the Predecessor Period and for the Successor Period are presented on different bases. The historical financial information of Act II prior to the Business Combination has not been reflected in the Predecessor Period financial statements.
On November 10, 2020, we executed and closed the Swerve Purchase Agreement. Swerve is a manufacturer and marketer of a portfolio of zero and reduced sugar, keto-friendly, and plant-based sweeteners and grain free, gluten free, and low/no sugar baking mixes. Upon the terms and subject to the conditions set forth in the Swerve Purchase Agreement, at the closing we purchased all of the issued and outstanding equity interests of both Swerve LLC and Swerve IP from RF Development, and both Swerve LLC and Swerve IP became wholly-owned subsidiaries of Whole Earth Brands. The transaction was structured to simultaneously sign and close and was not subject to any closing conditions.
Pursuant to the terms of the Swerve Purchase Agreement, we paid RF Development $80 million in cash for all of the issued and outstanding membership interests of both Swerve LLC and Swerve IP, which was subject to customary post-closing adjustments.
To finance a portion of the Swerve transaction, we utilized approximately $47.9 million under our $50 million revolving loan facility with Toronto Dominion (Texas) LLC.
On December 17, 2020, we entered into a stock purchase agreement (the “Wholesome Purchase Agreement”) with WSO Investments, Inc. (“WSO Investments” and together with its subsidiaries “Wholesome”), WSO Holdings, LP (“WSO Partnership”), Edwards Billington and Son, Limited (“EBS”), WSO Holdings, LLC (“WSO LLC,” and together with WSO Partnership and EBS, the “WSO Sellers”), and WSO Partnership, in its capacity as representative for the WSO Sellers. WSO Investments is the direct parent of its wholly-owned subsidiary Wholesome Sweeteners, Incorporated, which was formed to import, market, distribute, and sell organic sugars, unrefined specialty sugars, and related products.
On February 5, 2021, pursuant to the terms of the Wholesome Purchase Agreement, (i) we purchased and acquired all of the issued and outstanding shares of capital stock of WSO Investments from the WSO Sellers, for (x) an initial cash purchase price of $180 million (subject to customary post-closing adjustments), plus (y) as more thoroughly described below, up to an additional $55 million (the “Earn-Out Amount”) upon the satisfaction of certain post-closing financial metrics by Wholesome; and (ii) WSO Investments became an indirect wholly-owned subsidiary of the Company (collectively, the “Wholesome Transaction”). Subject to the terms and conditions of the Wholesome Purchase Agreement, and as more thoroughly described therein, payment of the Earn-Out Amount, in whole or in part, was subject to Wholesome achieving certain EBITDA thresholds at or above approximately $30 million during the period beginning August 29, 2020, and ending December 31, 2021 (the “Earn-Out Period”). A portion of the Earn-Out Amount (up to $27.5 million) could be paid, at our election, in freely tradeable, registered shares of Company common stock calculated using the 20-day volume weighted average trading price per share as of the date of determination. Calculation of the achievement of the Earn-Out Amount is subject to certain adjustments more thoroughly described in the Wholesome Purchase Agreement.
Following the completion of the Earn-Out Period, we determined, in accordance with the terms of the Purchase Agreement, that the sellers were entitled to receive the Earn-Out Amount in full. We elected to satisfy part of the Earn-Out Amount in common stock and on February 23, 2022, issued 2,659,574 shares of the Company’s common stock. The remaining $30 million portion of the $55 million Earn-Out Amount was paid in cash which was funded from available capacity under our revolving credit facility. The settlement of the earn-out resulted in a non-cash gain of $1.1 million that was recorded in the first quarter of 2022, which represents the difference in the value of the common stock issued using the 20-day volume weighted average trading price per share as compared to the trading price on the date of issuance.
In connection with the closing of the Wholesome Transaction, on February 5, 2021, we and certain of our subsidiaries entered into an amendment and restatement agreement (the “Amendment Agreement”) with Toronto Dominion (Texas) LLC, as administrative agent, and certain lenders signatory thereto, which amended and restated its existing senior secured loan agreement dated as of June 25, 2020 (as amended on September 4, 2020, the “Existing Credit Agreement,” and as further amended by the Amendment Agreement, the “Amended and Restated Credit Agreement”), by and among Toronto Dominion (Texas) LLC, as administrative agent, certain lenders signatory thereto and certain other parties. See Note 7 to our audited consolidated and combined financial statements for further description of the Amended and Restated Credit Agreement.
Covid-19 Impact
The COVID-19 pandemic has caused and continues to cause economic disruption and uncertainty in the U.S. and globally including as infection rates and new variants continue to evolve. We continue to closely monitor the impacts of the COVID-19 pandemic and remain focused on protecting the health and safety of our employees and maintaining our supply chain and inventory levels to meet customer demand. COVID-19 and its impacts are unprecedented. The extent of the pandemic’s impact on us will continue to depend upon our employees’ ability to work safely in our facilities, our customers’ ability to continue to operate or receive our products, the ability of our suppliers to continue to operate, and the level of activity and demand for the ultimate product and services of our customers or their customers.
Inflation and Supply Chain Impact
During 2022, we have continued to experience inflationary cost increases in raw materials and transportation costs, as well as supply chain challenges. We expect these cost pressures and supply chain challenges to continue in 2023. These cost increases have resulted in and could continue to result in negative impacts to our results of operations. However, we have taken measures to mitigate the impact of these inflationary pressures by implementing pricing actions.
There continues to be an increasingly competitive labor market at certain of our manufacturing facilities that has led too an increase in employee turnover and changes in the availability of our workers due to, among other things COVID-19 related absences. Labor shortages and increased turnover rates have resulted in and could continue to result in increased costs and could negatively impact our ability to meet customer demand. However, we expect we will be able to deliver products to fulfill customer orders on a timely basis and we intend to continue to monitor customer demand along with our supply chain and logistics capabilities to drive our business and meet our obligations.
Results of Operations
Consolidated
(In thousands of dollars)
| | | | | | | | | | | | | | | | | | | | | | | | | | | | | | |
| (Successor) | | | (Predecessor) | | |
| Year Ended December 31, 2022 | | Year Ended December 31, 2021 | | From June 26, 2020 to December 31, 2020 | | | From January 1, 2020 to June 25, 2020 | | | | |
| Product revenues, net | $ | 538,272 | | | $ | 493,973 | | | $ | 147,168 | | | | $ | 128,328 | | | | | |
| Cost of goods sold | 398,060 | | | 335,218 | | | 101,585 | | | | 77,627 | | | | | |
| Gross profit | 140,212 | | | 158,755 | | | 45,583 | | | | 50,701 | | | | | |
| | | | | | | | | | | | |
| Selling, general and administrative expenses | 99,735 | | | 113,141 | | | 44,616 | | | | 43,355 | | | | | |
| Amortization of intangible assets | 18,623 | | | 18,295 | | | 6,021 | | | | 4,927 | | | | | |
| Asset impairment charges | 46,500 | | | — | | | — | | | | 40,600 | | | | | |
| Restructuring and other expenses | — | | | 4,503 | | | 1,052 | | | | — | | | | | |
| | | | | | | | | | | | |
| Operating (loss) income | (24,646) | | | 22,816 | | | (6,106) | | | | (38,181) | | | | | |
| | | | | | | | | | | | |
| Change in fair value of warrant liabilities | 1,232 | | | 29 | | | — | | | | — | | | | | |
| Interest expense, net | (30,600) | | | (24,589) | | | (4,371) | | | | (238) | | | | | |
| Loss on extinguishment and debt transaction costs | — | | | (5,513) | | | — | | | | — | | | | | |
| Other income (expense), net | 1,051 | | | 196 | | | (578) | | | | 801 | | | | | |
| Loss before income taxes | (52,963) | | | (7,061) | | | (11,055) | | | | (37,618) | | | | | |
| Provision (benefit) for income taxes | 5,789 | | | (7,144) | | | (2,618) | | | | (3,482) | | | | | |
| Net (loss) income | $ | (58,752) | | | $ | 83 | | | $ | (8,437) | | | | $ | (34,136) | | | | | |
Year Ended December 31, 2022 Compared to Year Ended December 31, 2021
Product revenues, net. Product revenues, net for the year ended December 31, 2022 were $538.3 million, an increase of $44.3 million, or 9.0%, from $494.0 million for the year ended December 31, 2021 due to a $33.5 million increase in product revenues at Branded CPG and a $10.8 million increase in product revenues at Flavors & Ingredients. The increase in Branded CPG revenues was primarily a result of a full year of Wholesome (acquired February 5, 2021), as well as price increases, partially offset by declines in volume and unfavorable impacts from foreign exchange, as further discussed below. The increase in Flavors & Ingredients revenues was primarily driven by volume growth and price increases, partially offset by unfavorable impacts from foreign exchange, as further discussed below.
Cost of goods sold. Cost of goods sold for the year ended December 31, 2022 was $398.1 million, an increase of $62.8 million, or 18.7%, from $335.2 million for the year ended December 31, 2021. The increase was primarily due to a $36.3 million increase in costs as a result of a full year of Wholesome (acquired February 5, 2021), as well as costs associated with the new production operations at Branded CPG and increased logistics, energy and raw materials costs due to inflationary pressures, partially offset by a $1.0 million decline in stock-based compensation expense.
Selling, general and administrative expenses. Selling, general and administrative (“SG&A”) expenses for the year ended December 31, 2022 were $99.7 million, a decrease of $13.4 million, or 11.8%, from $113.1 million for the year ended December 31, 2021. The decrease was primarily due to a $13.5 million decline in public company readiness and acquisition related transaction expenses, a $5.3 million decrease in marketing costs, and a $2.2 million decrease in stock-based compensation expense, partially offset by $1.4 million of severance and related expenses, a $2.1 million increase in bonus expense, higher salaries from increased headcount in the second half of 2021 and increases in other corporate expenses including higher professional fees and insurance expense.
Amortization of intangible assets. Amortization of intangible assets for the year ended December 31, 2022 was $18.6 million, an increase of $0.3 million, or 1.8%, from $18.3 million for the year ended December 31, 2021 primarily due to amortization expense related to the intangible assets acquired as part of the Wholesome acquisition on February 5, 2021.
Asset impairment charges. Asset impairment charges were $46.5 million for the year ended December 31, 2022. The Company determined that the carrying values of the North America and LATAM reporting units within Branded CPG exceeded their respective fair values and as a result, the Company recognized non-cash goodwill impairment charges of $42.5 million related to the North America reporting unit and $4.0 million related to the LATAM reporting unit.
Restructuring and other expenses. Restructuring and other expenses were $4.5 million for the year ended December 31, 2021 and related primarily to certain disposal costs at our Camden, New Jersey facility, which was sold in the second quarter of 2021.
Change in fair value of warrant liabilities. Change in fair value of warrant liabilities for the year ended December 31, 2022 was a non-operating gain of $1.2 million, compared to a non-operating gain of $0.03 million for the year ended December 31, 2021, which is net of a $1.2 million non-operating gain that relates to the fiscal year ended December 31, 2020. See Notes 1, 8 and 9 to our audited consolidated and combined financial statements for further discussion.
Interest expense, net. Interest expense, net for the year ended December 31, 2022 was $30.6 million, an increase of $6.0 million, or 24.4%, from $24.6 million for the year ended December 31, 2021. The increase was primarily due to higher debt levels under our revolving credit facility and rising interest rates during the year ended December 31, 2022 compared to the year ended December 31, 2021.
Other income (expense), net. Other income (expense), net for the year ended December 31, 2022 was income of $1.1 million, an increase of $0.9 million from income of $0.2 million for the year ended December 31, 2021. The increase was primarily due to a $1.1 million non-cash gain related to the settlement of the Wholesome acquisition earn-out as further described above.
Provision (benefit) for income taxes. The provision for income taxes for the year ended December 31, 2022 was $5.8 million which relates primarily to current and deferred foreign taxes in connection with our operations in China, France and Switzerland partially offset by a deferred tax benefit in the U.S. The tax benefit on our U.S. operating loss was limited as it included an impairment of non-deductible goodwill and interest deductions within the U.S for which no tax benefit was provided. The benefit for income taxes for the year ended December 31, 2021 was $7.1 million.
The effective tax rate for the year ended December 31, 2022 was (10.9)%. The effective tax rate differs from the statutory federal rate of 21% primarily due to the impairment of non-deductible goodwill for which no tax benefit was provided, the U.S. tax effect of international operations including Global Intangible Low-Taxed Income (“GILTI”) and a limited benefit on current year interest deductions within the U.S.
The effective tax rate for the year ended December 31, 2021 was 101.2%. The effective tax rate differs from the statutory federal rate of 21% primarily due to state and local taxes, non-deductible expenses including executive compensation, stock-based compensation and transaction related costs coupled with the finalization of the Switzerland tax ruling, changes in U.K. tax laws and the reversal of uncertain tax liabilities as a result of the lapse of applicable statute of limitations.
Year Ended December 31, 2021 Compared to Year Ended December 31, 2020
Product revenues, net. Product revenues, net were $494.0 million for the year ended December 31, 2021. Product revenues, net for the combined year ended December 31, 2020 were $275.5 million, including $147.2 million for the period from June 26, 2020 through December 31, 2020 and $128.3 million from January 1, 2020 through June 25, 2020. Product revenues, net increased $218.5 million, or 79.3%, due to a $211.6 million increase in product revenues at Branded CPG and a $6.9 million increase in product revenues at Flavors & Ingredients. The increase in Branded CPG revenues was driven by $203.6 million of revenues from the acquisitions of Wholesome and Swerve, $2.8 million of organic Branded CPG growth and a $5.2 million favorable impact from foreign exchange.
Cost of goods sold. Cost of goods sold was $335.2 million for the year ended December 31, 2021. Cost of goods sold for the combined year ended December 31, 2020 was $179.2 million, including $101.6 million for the period from June 26, 2020 through December 31, 2020 and $77.6 million from January 1, 2020 through June 25, 2020. Cost of goods sold increased $156.0 million, or 87.1%, primarily driven by $154.2 million from the acquisitions of Wholesome and Swerve (which includes $1.6 million of purchase accounting adjustments related to inventory), additional costs associated with new production operations of $7.9 million, increased sales volume and mix and a $1.0 million increase in stock-based compensation expense, partially offset by a $17.6 million favorable change in purchase accounting adjustments related to inventory revaluation adjustments from the Business Combination (benefit of $5.5 million for the year ended December 31, 2021 compared to expense of $12.1 million for the year ended December 31, 2020).
Selling, general and administrative expenses. SG&A expenses were $113.1 million for the year ended December 31, 2021. SG&A expenses for the combined year ended December 31, 2020 were $88.0 million, including $44.6 million for the period from June 26, 2020 through December 31, 2020 and $43.4 million from January 1, 2020 through June 25, 2020. SG&A expenses increased $25.2 million, or 28.6%, primarily due to a $3.3 million increase in acquisition related transaction expenses, $17.0 million of SG&A expenses from the acquisitions of Wholesome and Swerve, a $3.2 million increase in bonus expense (the prior year included a reversal of $2.3 million of bonus expense in the third quarter of 2020 for certain employees who received a one-time grant of restricted stock units in lieu of an annual cash bonus for 2020), a $5.6 million increase in stock-based compensation expense, a $2.6 million increase in insurance expense, and a $2.4 million increase in marketing costs, partially offset by transaction bonuses of $11.2 million recorded in 2020.
Amortization of intangible assets. Amortization of intangible assets was $18.3 million for the year ended December 31, 2021. Amortization of intangible assets for the combined year ended December 31, 2020 was $10.9 million, including $6.0 million for the period from June 26, 2020 through December 31, 2020 and $4.9 million from January 1, 2020 through June 25, 2020. Amortization of intangible assets increased $7.3 million, or 67.1%, primarily due to the amortization expense related to the intangible assets acquired as part of the Wholesome and Swerve acquisitions.
Asset impairment charges. There were no asset impairment charges for the year ended December 31, 2021. Asset impairment charges were $40.6 million in the Predecessor period and for the combined year ended December 31, 2020 and included an impairment charge of $22.9 million related to indefinite-lived intangible assets and a goodwill impairment charge of $17.7 million. The goodwill impairment charge of $17.7 million was the result of the Flavors & Ingredients and Branded CPG reporting units carrying value exceeding their fair value by $6.6 million and $11.1 million, respectively. The asset impairment charges were recorded in the first quarter of 2020.
Restructuring and other expenses. Restructuring and other expenses were $4.5 million for the year ended December 31, 2021 and related primarily to certain disposal costs at our Camden, New Jersey facility, which was sold in the second quarter of 2021. Restructuring and other expenses for the combined year ended December 31, 2020 were $1.1 million and related to employee termination benefits associated with restructuring plans to streamline processes, consolidate facilities and eliminate various positions in operations and general and administrative areas.
Change in fair value of warrant liabilities. Change in fair value of warrant liabilities for the year ended December 31, 2021 was a non-operating gain of $0.03 million, which is net of a $1.2 million non-operating gain that relates to the fiscal year ended December 31, 2020. See Notes 1, 8 and 9 to our audited consolidated and combined financial statements for further discussion.
Interest expense, net. Interest expense, net was $24.6 million for the year ended December 31, 2021. Interest expense, net for the combined year ended December 31, 2020 was $4.6 million, including $4.4 million for the period from June 26, 2020 through December 31, 2020 and $0.2 million from January 1, 2020 through June 25, 2020. Interest expense, net increased $20.0 million due to higher debt levels under our new credit facilities and the amortization of debt issuance costs.
Other income (expense), net. Other income (expense), net was income of $0.2 million for the year ended December 31, 2021. Other income (expense), net for the combined year ended December 31, 2020 was income of $0.2 million, including expense of $0.6 million for the period from June 26, 2020 through December 31, 2020 and income of $0.8 million from January 1, 2020 through June 25, 2020. Other income (expense), net was flat year over year.
Provision (benefit) for income taxes. The income tax benefit was $7.1 million for the year ended December 31, 2021. The income tax benefit for the combined year ended December 31, 2020 was $6.1 million, including $2.6 million for the period from June 26, 2020 through December 31, 2020 and $3.5 million for the period from January 1, 2020 through June 25, 2020.
The effective tax rate for the year ended December 31, 2021 was 101.2%. The effective tax rate differs from the statutory federal rate of 21% primarily due to state and local taxes, non-deductible expenses including executive compensation, stock-based compensation and transaction related costs coupled with the finalization of the Switzerland tax ruling, changes in U.K. tax laws and the reversal of uncertain tax liabilities as a result of the lapse of applicable statute of limitations.
The effective tax rate for the Successor period from June 26, 2020 through December 31, 2020 was 23.7%. The effective tax rate differs from the statutory federal rate of 21% primarily due to the U.S. tax effect of international operations, state and local taxes and tax rate differences related to our foreign operations. The effective rate for the Predecessor period from January 1, 2020 to June 25, 2020 was 9.3% and differs from the federal statutory rate of 21% primarily due to the impairment of non-deductible goodwill, the U.S. effect of foreign operations and a decrease in our uncertain tax position liability.
Results of Operations by Segment
Branded CPG
| | | | | | | | | | | | | | | | | | | | | | | | | | | | | | |
| (Successor) | | | (Predecessor) | | |
| (In thousands) | Year Ended December 31, 2022 | | Year Ended December 31, 2021 | | From June 26, 2020 to December 31, 2020 | | | From January 1, 2020 to June 25, 2020 | | | | |
| Product revenues, net | $ | 422,638 | | | $ | 389,174 | | | $ | 96,857 | | | | $ | 80,749 | | | | | |
| Operating (loss) income | (30,182) | | | 34,918 | | | 13,463 | | | | (5,055) | | | | | |
Year Ended December 31, 2022 Compared to Year Ended December 31, 2021
Segment product revenues, net. Product revenues, net for Branded CPG for the year ended December 31, 2022 were $422.6 million, an increase of $33.5 million, or 8.6%, from $389.2 million for the year ended December 31, 2021, primarily driven by a $40.1 million increase in revenues at Wholesome due to a full year of results in 2022 (acquired February 5, 2021) as well as both higher pricing and volume. This increase was partially offset by a $6.6 million decline in revenues for all other Branded CPG business as a $10.1 million increase in sales largely due to higher pricing was more than offset by a $6.2 million decline in sales due to the discontinuance of certain private label contracts and a $10.5 million unfavorable impact of foreign exchange.
Segment operating (loss) income. Operating loss for Branded CPG for the year ended December 31, 2022 was $30.2 million, a decrease of $65.1 million from operating income of $34.9 million for the year ended December 31, 2021, primarily due to the $46.5 million non-cash goodwill impairment charge, an increase in costs associated with new production operations of $14.9 million, increased logistics, energy and raw materials costs due to inflationary pressures, partially offset by a $6.4 million increase in operating income at Wholesome driven by a full year of results (acquired February 5, 2021), a $5.3 million decrease in marketing costs, and a $1.2 million reduction in stock-based compensation expense in the segment.
Year Ended December 31, 2021 Compared to Year Ended December 31, 2020
Segment product revenues, net. Product revenues, net for Branded CPG for the year ended December 31, 2021 were $389.2 million. Product revenues, net for Branded CPG for the combined year ended December 31, 2020 were $177.6 million, including $96.9 million for the period from June 26, 2020 through December 31, 2020 and $80.7 million from January 1, 2020 through June 25, 2020. Product revenues, net for Branded CPG increased $211.6 million primarily due to $203.6 million of revenues as a result of the acquisitions of Wholesome and Swerve, $2.8 million of global organic Branded CPG growth and a $5.2 million favorable impact of foreign exchange.
Segment operating income (loss). Operating income for Branded CPG for the year ended December 31, 2021 was $34.9 million. Operating income for Branded CPG for the combined year ended December 31, 2020 was $8.4 million, including operating income of $13.5 million for the period from June 26, 2020 through December 31, 2020 and an operating loss of $5.1 million from January 1, 2020 through June 25, 2020. Operating income for Branded CPG increased $26.5 million, primarily due to a goodwill impairment charge of $11.1 million and transaction bonuses of $2.7 million reflected in the prior year results that did not reoccur in 2021, additional operating income of $24.2 million related to the acquisitions of Wholesome and Swerve (which includes $1.6 million of amortization of inventory fair value adjustments), a reduction of $3.5 million in purchase accounting adjustments related to inventory revaluations from the Business Combination, as well as organic revenue growth, partially offset by costs associated with new production operations of $7.9 million, a $2.4 million increase in marketing costs, a $1.9 million increase in bonus expense (the prior year included a reversal of $1.2 million of bonus expense as described above) and a $2.5 million increase in stock-based compensation expense in 2021.
Flavors & Ingredients
| | | | | | | | | | | | | | | | | | | | | | | | | | | | | | |
| (Successor) | | | (Predecessor) | | |
| (In thousands) | Year Ended December 31, 2022 | | Year Ended December 31, 2021 | | From June 26, 2020 to December 31, 2020 | | | From January 1, 2020 to June 25, 2020 | | | | |
| Product revenues, net | $ | 115,634 | | | $ | 104,799 | | | $ | 50,311 | | | | $ | 47,579 | | | | | |
| Operating income (loss) | 32,505 | | | 21,860 | | | (2,645) | | | | (23,718) | | | | | |
Year Ended December 31, 2022 Compared to Year Ended December 31, 2021
Segment product revenues, net. Product revenues, net for Flavors & Ingredients for the year ended December 31, 2022 were $115.6 million, an increase of $10.8 million, or 10.3%, from $104.8 million for the year ended December 31, 2021, primarily driven by increases in licorice extracts and pure derivatives primarily due to volume and price growth, partially offset by a $2.2 million unfavorable impact of foreign exchange .
Segment operating income (loss). Operating income for Flavors & Ingredients for the year ended December 31, 2022 was $32.5 million, an increase of $10.6 million, or 48.7%, from $21.9 million for the year ended December 31, 2021, primarily driven by increased revenue of $10.8 million and a $4.5 million decrease in restructuring and other expenses included in the prior year results that did not re-occur in 2022, partially offset by a $4.6 million increase in cost of goods sold. The increase in cost of goods sold was largely due to the increase in revenue as well as a $2.9 million unfavorable change in amortization of purchase accounting adjustments related to inventory revaluations in the year ended December 31, 2022 (benefit of $2.5 million in the year ended December 31, 2022 compared to a benefit of $5.5 million in the year ended December 31, 2021).
Year Ended December 31, 2021 Compared to Year Ended December 31, 2020
Segment product revenues, net. Product revenues, net for Flavors & Ingredients for the year ended December 31, 2021 were $104.8 million. Product revenues, net for Flavors & Ingredients for the combined year ended December 31, 2020 were $97.9 million, including $50.3 million for the period from June 26, 2020 through December 31, 2020 and $47.6 million from January 1, 2020 through June 25, 2020. Product revenues, net for Flavors & Ingredients increased $6.9 million, or 7.1%, primarily driven by increases in licorice extracts and our Magnasweet® product lines.
Segment operating income (loss). Operating income for Flavors & Ingredients for the year ended December 31, 2021 was $21.9 million. Operating loss for Flavors & Ingredients for the combined year ended December 31, 2020 was $26.4 million, including $2.6 million for the period from June 26, 2020 through December 31, 2020 and $23.7 million from January 1, 2020 through June 25, 2020. Operating income for Flavors & Ingredients increased $48.2 million, primarily due to higher revenues, asset impairment charges totaling $29.5 million and transaction bonuses of $4.2 million, both included in the prior year results that did not re-occur in 2021, a favorable change in purchase accounting adjustments related to inventory of $14.1 million (benefit of $5.5 million in 2021 compared to expense of $8.6 million in 2020), a $1.5 million reduction in salaries as a result of position eliminations in 2020 and 2021, and lower operating expenses related to the Camden facility that was sold in the second quarter of 2021, partially offset by a $3.5 million increase in facility closure and restructuring costs, a $0.9 million increase in stock-based compensation expense and a $1.0 million increase in amortization expense due to purchase accounting revaluations of intangible assets.
Corporate
| | | | | | | | | | | | | | | | | | | | | | | | | | | | | | |
| (Successor) | | | (Predecessor) | | |
| (In thousands) | Year Ended December 31, 2022 | | Year Ended December 31, 2021 | | From June 26, 2020 to December 31, 2020 | | | From January 1, 2020 to June 25, 2020 | | | | |
| Operating loss | $ | (26,969) | | | $ | (33,962) | | | $ | (16,924) | | | | $ | (9,408) | | | | | |
Year Ended December 31, 2022 Compared to Year Ended December 31, 2021
Operating loss. Operating loss for Corporate for the year ended December 31, 2022 was $27.0 million, a decrease of $7.0 million or 20.6% from $34.0 million for the year ended December 31, 2021, primarily driven by an $11.7 million decrease in acquisition related transaction expenses and public company readiness expenses, partially offset by a $2.0 million increase in compensation expense (primarily due to increased headcount in the second half of 2021) and increases in other corporate expenses including professional fees and insurance expense.
Year Ended December 31, 2021 Compared to Year Ended December 31, 2020
Operating loss. Operating loss for Corporate for the year ended December 31, 2021 was $34.0 million. Operating loss for the combined year ended December 31, 2020 was $26.3 million, including $16.9 million for the period from June 26, 2020 through December 31, 2020 and $9.4 million from January 1, 2020 through June 25, 2020. Operating loss rose $7.6 million, or 29.0%, primarily due to a $3.3 million increase in acquisition related transaction expenses, a $3.1 million increase in stock-based compensation expense, a $2.6 million increase in insurance expense and higher salaries due to new hires and the full year impact of 2020 hires to operate as a public company, partially offset by $2.6 million of lower bonus expense as 2020 included $4.8 million of transaction bonuses.
Liquidity and Capital Resources
We have historically funded operations with cash flow from operations and, when needed, with borrowings, which are described below.
As of December 31, 2022, we had cash and cash equivalents of $28.7 million. Our principal source of liquidity is our cash from operations. We also have access to credit markets, if needed, for liquidity or general corporate purposes, including our revolving credit facility. We believe our sources of liquidity and capital, and our credit facilities will be sufficient to finance our continued operations, growth strategy and additional expenses we expect to incur for at least the next twelve months. Overall, we do not anticipate negative effects to our funding sources that would have a material effect on our liquidity. However, in connection with the COVID-19 pandemic and other recent global events, if a serious economic crisis ensues, it could have a material adverse effect on our liquidity, results of operations and financial condition.
The following table shows summary cash flow information for the years ended December 31, 2022 and December 31, 2021, and the periods from June 26, 2020 through December 31, 2020 and January 1, 2020 through June 25, 2020 (in thousands):
| | | | | | | | | | | | | | | | | | | | | | | | | | |
| | (Successor) | | | (Predecessor) |
| Year Ended December 31, 2022 | | Year Ended December 31, 2021 | | From June 26, 2020 to December 31, 2020 | | | From January 1, 2020 to
June 25, 2020 |
| Net cash (used in) provided by operating activities | $ | (5,810) | | | $ | 9,482 | | | $ | (9,445) | | | | $ | 19,908 | |
| Net cash used in investing activities | (8,419) | | | (197,913) | | | (282,122) | | | | (3,532) | |
| Net cash provided by (used in) financing activities | 16,525 | | | 199,330 | | | 252,216 | | | | (16,924) | |
| Effect of exchange rates on cash and cash equivalents | (1,916) | | | 499 | | | 714 | | | | 215 | |
| Net change in cash and cash equivalents | $ | 380 | | | $ | 11,398 | | | $ | (38,637) | | | | $ | (333) | |
Operating activities. Net cash used in operating activities was $5.8 million for the year ended December 31, 2022 compared to cash provided by operating activities of $9.5 million for the year ended December 31, 2021. The decrease in cash was primarily attributable to unfavorable working capital changes, higher income tax and interest payments and lower cash flows from operating results during the year ended December 31, 2022. Cash paid for interest for the year ended December 31, 2022 was $28.4 million compared to $21.2 million for the year ended December 31, 2021. Cash paid for income taxes, net of income tax refunds, was $9.1 million for the year ended December 31, 2022 compared to $4.5 million for the year ended December 31, 2021.
Net cash provided by operating activities was $9.5 million for the year ended December 31, 2021, a decrease of $1.0 million compared to $10.5 million for the combined year ended December 31, 2020. The decrease was primarily attributable to higher cash paid for interest and unfavorable working capital changes, largely offset by higher cash generated from operations.
Investing activities. Net cash used in investing activities was $8.4 million for the year ended December 31, 2022 and included capital expenditures of $8.9 million and proceeds from the sale of fixed assets of $0.5 million.
Net cash used in investing activities was $197.9 million for the year ended December 31, 2021, which included cash paid of $191.2 million, net of cash acquired, related to the acquisition of Wholesome, $1.0 million of cash received for the final working capital settlement related to the acquisition of Swerve, capital expenditures of $12.2 million and proceeds from the sale of one of our facilities of $4.5 million.
Net cash used in investing activities was $282.1 million in the period from June 26, 2020 through December 31, 2020, which included cash paid of $376.7 million, net of cash acquired, related to the Business Combination, $178.9 million of cash transferred from the trust account, $79.8 million related to the Swerve acquisition and capital expenditures of $4.5 million. Net cash used in investing activities was $3.5 million from January 1, 2020 through June 25, 2020 and was entirely related to capital expenditures.
We expect 2023 capital expenditures to be approximately $9 million which includes manufacturing equipment at our production facilities and information technology expenditures.
Financing activities. Net cash provided by financing activities was $16.5 million for the year ended December 31, 2022 and reflects $54.0 million of proceeds from the revolving credit facility, repayments of the revolving credit facility of $3.0 million, repayments of long-term debt of $3.8 million, cash payment for the Wholesome acquisition earn-out of $29.1 million (amount is net of $0.9 million related to transaction bonuses paid in connection with the earn-out and reflected in operating activities), payments of $0.9 million for employee tax withholdings related to net share settlements of share awards and payments of debt issuance costs of $0.7 million.
Net cash provided by financing activities was $199.3 million for the year ended December 31, 2021 and reflects $400 million of proceeds from the Credit Facilities (as defined and described below), repayment of the revolving credit facility of $47.9 million, repayments of long-term debt of $139.3 million, payments of debt issuance costs of $11.6 million and payments of $1.9 million for tax withholdings related to net share settlements of share-based awards.
Net cash provided by financing activities was $252.2 million in the period from June 26, 2020 through December 31, 2020 and reflects $140.0 million of proceeds from the Loan Agreement (as defined and described below), net of debt issuance costs of $7.1 million, proceeds from the revolving credit facility of $47.9 million, proceeds from the sale of common stock and warrants of $75.0 million and repayments of long-term debt of $3.5 million. Net cash used in financing activities was $16.9 million from January 1, 2020 through June 25, 2020 due to $8.5 million of repayments, offset by $3.5 million of borrowings related to the prior revolving credit facility and $11.9 million due to funding to the parent.
Debt
At December 31, 2022, the Company’s senior secured loan agreement consisted of a senior secured term loan facility (the “Term Loan Facility”) of $375 million and a revolving credit facility of up to $125 million (the “Revolving Facility,” and together with the Term Loan Facility, the “Credit Facilities”). See Note 7 to our audited consolidated and combined financial statements for additional information on our Credit Facilities.
As of December 31, 2022 and December 31, 2021, term loan borrowings were $359.9 million and $362.2 million, respectively, net of unamortized discount and debt issuance costs of $8.5 million and $10.0 million, respectively. There were $76.0 million and $25.0 million of borrowings under the revolving credit facility as of December 31, 2022 and December 31, 2021, respectively. As of December 31, 2022 and December 31, 2021, the Company’s unamortized debt issuance costs related to the revolving credit facility were $2.0 million and $1.8 million, respectively, which are included in other assets in the consolidated balance sheet. Additionally, as of both December 31, 2022 and 2021, there were $2.1 million of outstanding letters of credit that reduced our availability under the revolving credit facility.
As further described in the Acquisition section above, following the completion of the Wholesome Earn-Out Period, we determined, in accordance with the terms of the Purchase Agreement, that the sellers were entitled to receive the Earn-Out Amount in full. We elected to satisfy part of the Earn-Out Amount in common stock and on February 23, 2022, issued 2,659,574 shares of the Company’s common stock. The remaining $30 million portion of the $55 million Earn-Out Amount was paid in cash which was funded from available capacity under our revolving credit facility.
On June 15, 2022, the Company and certain of its subsidiaries entered into a first amendment (the “Amendment”) to the Amended and Restated Agreement dated as of February 5, 2021. The Amendment increased the aggregate principal amount of the Revolving Credit Facility from $75 million to $125 million (the “Amended Revolving Credit Facility”) and transitioned from LIBOR to Secured Overnight Financing Rate (“SOFR”) as the benchmark for purposes of calculating interest for all loans outstanding under the Amended and Restated Credit Agreement. At the election of the Company, loans outstanding under the Amended and Restated Credit Agreement will accrue interest at a rate per annum equal to (i) term SOFR plus 0.10%, 0.15%, or 0.25% in case of, respectively, a one-month, three-month, or six-month interest period (“Adjusted Term SOFR”), or (ii) the greater of the prime rate, the federal funds effective rate plus 0.50%, and one-month Adjusted Term SOFR plus 1.00%, in each case plus the applicable margin which is equal to (i) with respect to the Amended Revolving Credit Facility and letters of credit, (A) 2.75%, in the case of base rate advances, and (B) 3.75% in the case of SOFR advances, and (ii) with respect to the Term Loan Facility, (A) 3.50%, in the case of base rate advances, and (B) 4.50% in the case of SOFR advances. In connection with the Amendment, the Company paid fees and incurred transactions costs of $0.7 million, all of which was deferred.
The transition to SOFR did not materially impact the interest rates applied to the Company’s borrowings. No other material changes were made to the terms of the Company’s Amended and Restated Agreement as a result of the Amendment.
Contractual Obligations
The following table summarizes certain of our obligations as of December 31, 2022 and the estimated timing and effect that such obligations are expected to have on liquidity and cash flows in future periods (in thousands):
| | | | | | | | | | | | | | | | | |
| | Total | | Current | | Long-Term |
| Debt | $ | 444,438 | | | $ | 3,750 | | | $ | 440,688 | |
| Interest on debt (1) | 191,532 | | | 40,801 | | | 150,731 | |
| Minimum lease obligations (2) | 22,797 | | | 9,458 | | | 13,339 | |
| Raw materials purchase obligations | 77,610 | | | 75,812 | | | 1,798 | |
| Other purchase obligations | 4,944 | | | 3,120 | | | 1,824 | |
| Total | $ | 741,321 | | | $ | 132,941 | | | $ | 608,380 | |
(1) Calculated based on debt outstanding as of December 31, 2022 and the interest rates as of that date.
(2) Minimum lease obligations have not been reduced by sublease rental income.
Critical Accounting Policies and Estimates
Our significant accounting policies are summarized in Note 1 to our audited consolidated and combined financial statements. These policies conform with U.S. Generally Accepted Accounting Principles (“GAAP”) and reflect practices appropriate to our businesses. The preparation of our consolidated and combined financial statements in conformity with U.S. GAAP requires management to make estimates and assumptions that affect the amounts reported in the consolidated and combined financial statements and accompanying notes thereto. Actual results could differ from these estimates. We evaluate our policies, estimates and assumptions on an ongoing basis.
Our critical accounting policies and estimates relate to revenue recognition, goodwill and other indefinite-lived intangible assets, impairment review of long-lived assets, income taxes and pension benefits. Management continually evaluates the development, selection and disclosure of our critical accounting policies and estimates and the application of these policies and estimates. In addition, there are other items within the consolidated and combined financial statements that require the application of accounting policies and estimation, but are not deemed to be critical accounting policies and estimates. Changes in the estimates used in these and other items could have a material impact on our consolidated and combined financial statements.
Revenue Recognition—In accordance with Accounting Standards Codification (“ASC”) 606, “Revenue from Contracts with Customers” the Company recognizes revenue when control of the promised goods or services is transferred to the customers, in an amount that reflects the consideration the Company expects to be entitled to in exchange for those goods or services. Revenues are primarily derived from customer orders for the purchase of products and are generally recognized when the product is shipped or delivered depending on the arrangement with the customer. The Company made an accounting policy election to exclude from the measurement of the transaction price sales taxes and all other items of a similar nature, and also elected to account for shipping and handling activities as a fulfillment of the promise to transfer the goods. Accordingly, shipping and handling costs are included in cost of sales.
Branded CPG may offer promotional activities (e.g. coupons, trade discounts and other promotional activities) to its customers. These variable consideration amounts are estimated for each customer based on specific arrangements/agreements, an analysis of historical volume, and/or current activity with that customer. Reassessment of variable consideration estimates is done at each reporting date throughout the contract period until the uncertainty is resolved (e.g. promotional campaign is closed and settled with customer).
Historically, the Company has encountered limited instances whereby customers rejected products as a result of orders being materially inaccurate and/or products being defective. The Company tracks the reason codes for those customer returns. Based on that, the materiality of such returns is assessed. A return reserve is calculated (based on historical data as described above) every month to record an adjustment to net sales; these adjustments have not been significant.
Goodwill and Other Indefinite-Lived Intangible Assets—We review goodwill and other indefinite-lived intangible assets for impairment annually, or more frequently if events or changes in circumstances indicate that an asset may be impaired, in accordance with ASC Topic 350, “Intangibles—Goodwill and Other.” Under ASC Topic 350, the impairment review of goodwill and other intangible assets not subject to amortization must be based on estimated fair values.
Our annual impairment review measurement date is in the fourth quarter of each year. In performing the annual assessment, we have the option of performing a qualitative assessment to determine if it is more likely than not that a reporting unit has been impaired. As part of the qualitative assessment for the reporting units, we evaluate the factors that are specific to the reporting units as well as industry and macroeconomic factors (including changes in interest and discount rates). The reporting unit specific factors may include cost factors, a comparison of current year results to prior year, current year budget and future projected financial performance. We also consider the change in the overall enterprise value of the Company compared to the prior year.
If we determine that it is more likely than not that a reporting unit is impaired or if we elect not to perform the optional qualitative assessment, a quantitative assessment is performed utilizing both the income and market approaches to estimate the fair value of its reporting units. The income approach involves discounting future estimated cash flows. The discount rate used is the value-weighted average of the reporting unit’s estimated cost of equity and debt (“cost of capital”) derived using both known and estimated customary market metrics adjusted for company specific risks. We perform sensitivity tests with respect to growth rates and discount rates used in the income approach. In applying the market approach, valuation multiples are derived from historical and projected operating data of selected guideline companies; evaluated and adjusted, if necessary, based on the strengths and weaknesses of the reporting unit relative to the selected guideline companies; and applied to the appropriate historical and/or projected operating data to arrive at an indication of fair value. We typically weight the results of the income and market approaches equally. If the reporting unit’s carrying value exceeds its estimated fair value, then an impairment is recorded for the difference, limited to the total amount of goodwill allocated to the reporting unit.
As disclosed in Note 6 to our audited consolidated and combined financial statements, as a result of our 2022 impairment test, the Company recorded non-cash goodwill impairment charges related to our North America and LATAM reporting units within the Branded CPG segment of $42.5 million and $4.0 million, respectively. The reporting units that were impaired were written down to their respective fair values resulting in zero excess fair value over carrying amounts as of the fourth quarter assessment date. Accordingly, our North America reporting unit has 10% or less excess fair value over carrying amount and a heightened risk of future impairments. The $4.0 million non-cash goodwill impairment charge related to our LATAM reporting unit was the full amount of goodwill associated with that reporting unit. The remaining reporting units have more than 10% excess fair value over carrying amounts as of the latest 2022 impairment test. The determination of estimated fair values requires significant judgments in estimating several factors, including, future cash flows, terminal growth rates, income tax considerations and discount rates. If current expectations of future cash flows are not met, if market factors outside of the Company’s control change, including those impacting discount rates, income tax rates and foreign currency exchange rates, or if management’s expectations or plans otherwise change, then one or more of our reporting units might become impaired in the future. After the impairments, the goodwill carrying amounts of the North America and LATAM reporting units was approximately $80.5 million and $0 million, respectively.
The discount rate and long-term growth rate used to estimate the fair value of the reporting unit with 10% or less excess fair value over carrying amount, as well as the goodwill carrying amount, as of the 2022 impairment test, were as follows:
| | | | | | | | | | | | | | | | | | | | |
| Reporting Unit | | Goodwill Carrying Amount
(in thousands) | | Discount Rate | | Long-Term Growth Rate |
| North America | | $ | 80,486 | | | 13.0% | | 2.5% |
| | | | | | |
Assumptions used in impairment testing are made at a point in time and require significant judgment; therefore, they are subject to change based on the facts and circumstances present at each annual impairment test date. Additionally, these assumptions are generally interdependent and do not change in isolation. However, as it is reasonably possible that changes in assumptions could occur, as a sensitivity measure, we have presented the estimated effects of isolated changes in the discount rate and long-term growth rate on the fair values of our reporting unit with 10% or less excess fair value over carrying amount. These estimated changes in fair value are not necessarily representative of the actual impairment that would be recorded in the event of a fair value decline.
If we had changed the assumptions used to estimate the fair value of our reporting unit with 10% or less excess fair value over carrying amount, as of the 2022 impairment test, these isolated changes, which are reasonably possible to occur, would have led to the following increase/(decrease) in the aggregate fair value of the reporting unit (in thousands):
| | | | | | | | | | | | | | | | | | | | | | | | | | |
| | Discount Rate | | Long-Term Growth Rate |
| | 50-Basis-Point | | 25-Basis-Point |
| Reporting Unit | | Increase | | Decrease | | Increase | | Decrease |
| North America | | $ | (7,513) | | | $ | 8,268 | | | $ | 1,481 | | | $ | (1,413) | |
| | | | | | | | |
We typically evaluate impairment of indefinite-lived intangible assets, which relates to our product formulations, by first performing a qualitative assessment. If we elect to bypass the qualitative assessment or we determine that it is more likely than not that the fair value of the product formulations is less than its carrying value, a quantitative assessment is then performed using the relief from royalty method under the income approach to estimate the fair value. Some of the more significant assumptions inherent in estimating the fair value include the estimated future annual sales, royalty rates (as a percentage of sales that would hypothetically be charged by a licensor of the brand to an unrelated licensee), income tax considerations and a discount rate that reflects the level of risk.
See Note 6 to our audited consolidated and combined financial statements for additional information.
Impairment Review of Long-Lived Assets—In accordance with ASC Topic 360, “Property, Plant and Equipment,” we evaluate the carrying value of long-lived assets to be held and used whenever events or changes in circumstances indicate that the carrying amount of a long-lived asset or asset group may be impaired. When such events occur, we compare the sum of the future undiscounted cash flows expected to be generated from the asset or asset group over its remaining depreciable life to the carrying value. If this comparison indicates that there is an impairment, the carrying amount of the long-lived asset would then be reduced to the estimated fair value, which generally approximates discounted cash flows. We also evaluate the amortization periods of assets to determine whether events or circumstances warrant revised estimates of useful lives. Our applicable long-lived assets include property, plant and equipment and definite-lived intangible assets.
Income Taxes—The provision for income taxes is determined using the asset and liability method in accordance with ASC 740, “Accounting for Income Taxes.” The asset and liability method provides that deferred tax assets and liabilities are recognized for the expected future tax consequences of temporary differences between the financial reporting and tax bases of assets and liabilities and for operating loss and tax credit carry forwards. Deferred tax assets and liabilities are measured using the currently enacted tax rates and laws that will be in effect when the differences are expected to reverse. The Company records a valuation allowance to reduce deferred tax assets to the amount that is believed more likely than not to be realized.
For the Predecessor period, income taxes as presented herein are attributable to current and deferred income taxes of the Company’s financial statements in a manner that is systematic, rational, and consistent with the asset and liability method described by ASC 740. Accordingly, the Company’s income tax provision during the predecessor period was prepared following the separate return method. The separate return method applies ASC 740 to the stand-alone financial statements of each member of the combined group as if the group member were a separate taxpayer and a stand-alone enterprise. Use of the separate return method may result in differences when the sum of the amounts allocated to stand-alone tax provisions are compared with amounts presented in the combined financial statements. In that event, the related deferred tax assets and liabilities could be significantly different from those presented herein. The combined financial statements reflect the Company’s portion of income taxes payable as if the Company had been a separate taxpayer.
The Company made a policy election to treat the income tax due on U.S. inclusion of the global intangible low taxed income (“GILTI”) provisions as a period expense when incurred.
Uncertainty in Income Taxes—The Company accounts for uncertain tax positions in accordance with the authoritative guidance issued under ASC 740, which addresses the determination of whether tax benefits claimed or expected to be claimed on a tax return should be recorded in the financial statements. The Company may recognize the tax benefit from an uncertain tax position only if it is more likely than not that the tax position will be sustained on examination by the taxing authorities based on the technical merits of the position. The tax benefits recognized in the financial statements from such position should be measured based on the largest benefit that has a greater than fifty percent likelihood of being realized upon ultimate settlement. The Company provides loss contingencies for federal, state and international tax matters relating to potential tax examination issues, planning initiatives and compliance responsibilities. The development of these reserves requires judgements about tax issues, potential outcomes and timing, which if different, may materially impact the Company’s financial condition and results of operations. The Company classifies interest and penalties associated with income taxes as a component of the provision (benefit) for income taxes in the consolidated and combined statements of operations.
Pension Benefits—Retirement benefits are provided to certain current and former employees through qualified and non-qualified defined benefit pension plans sponsored by us. In 2022, the Company terminated its qualified defined benefit pension plan. The surplus assets of the terminated plan will be used, as prescribed in the applicable regulations, to fund future contributions to the defined contribution plan at Flavors and Ingredients. At December 31, 2022, the remaining surplus of the plan was approximately $2.5 million. Prior to the termination of the qualified defined benefit pension plan, it was our policy to fund the minimum for our company-sponsored pension plans as required by the Employee Retirement Income Security Act of 1974, as amended (“ERISA”). The expected cost of providing the qualified pension plan benefits was accrued over the years that the employees render services, until the plan was frozen on December 31, 2019. The expected cost of providing the non-qualified pension plan benefits is accrued over the years that the employees rendered services. It is our policy to fund non-qualified pension benefits as payments are due. Accounting for pension benefits requires the use of several assumptions and estimates. Actual experience or changes to these assumptions and other estimates could have a significant impact on our consolidated and combined results of operations and financial position. See Note 12 to our audited consolidated and combined financial statements for a summary of all of the key assumptions related to pension benefits as well as a description of our defined benefit pension plans as well as additional disclosures.
We recognize the overfunded or underfunded status of our defined benefit pensions as an asset or liability in our consolidated balance sheets and recognize changes in that funded status in the year in which changes occur through comprehensive income (loss). Any changes in the funded status deferred into accumulated other comprehensive income (loss) are amortized within other income (expense) in future periods using the corridor approach, over an appropriate term. The corridor is 10% of the greater of the market-related value of the plan’s asset or projected benefit obligation.
For our qualified pension plan we utilized a blend of appropriate durations of annuity purchase contracts at December 31, 2021. For our non-qualified pension plans we utilized the Aon Hewitt AA-Only Bond Universe Yield Curve (the “Aon Hewitt Yield Curve”) for discounting future benefit obligations and calculating interest cost. The Aon Hewitt Yield Curve represents the yield on high quality (AA and above) corporate bonds that closely match the cash flows of the estimated payouts for our benefit obligations. As of December 31, 2022, a 0.5% decrease in our discount rate assumptions of 2.38% for our qualified pension plan and 2.78% for our non-qualified pension plans would result in a nominal decrease in our pension expense for both our qualified pension plan and our non-qualified pension plans for the year ended December 31, 2022.
Prior to terminating the qualified defined benefit pension plan in 2022, we used a multi-pronged approach to determine our 1.70% assumption for the long-term expected rate of return on pension plan assets. This approach included a review of actual historical returns achieved and anticipated long-term performance of each asset class. As of December 31, 2022, a 0.5% decrease in our long-term rate of return assumption would result in a $0.1 million increase in the pension expense of our qualified pension plan for the year ended December 31, 2022. Our pension plan assets earned a return of 0.7% in 2022 and 2.9% in 2021. The asset returns are net of administrative expenses.
Our pension actuarial valuation also incorporates other factors such as mortality rates. The actuarial assumptions used by us may differ materially from actual results due to, among other things, longer or shorter life spans of plan participants. Differences in these assumptions could significantly impact the actual amount of net periodic benefit cost and pension liability recorded by us.
Foreign Currency Translation—The Company has determined that the functional currency for each combined subsidiary is its local currency, except for certain entities whose functional currency is the U.S. dollar. Assets and liabilities of entities outside the U.S. are translated into U.S. dollars at the exchange rates in effect at the end of each period; income and expense items are translated at each period’s average exchange rate; and any resulting translation difference is reported and accumulated as a separate component of combined statements of net parent investment, except for any entities which may operate in highly inflationary economies. Gains and losses resulting from transactions in other than functional currencies are reflected in operating results, except for transactions of a long-term nature.
Remeasurements of European entities whose functional currency is the U.S. dollar as well as translation adjustments for entities operating in highly inflationary economies and impacts of foreign currency transactions are recognized currently in other expense (income), net.
Beginning January 1, 2019, the Company was required to apply highly-inflationary accounting to its Argentinian subsidiary. This accounting treatment requires a change in the subsidiary’s functional currency from the local currency (Argentinian Peso) to the parent’s reporting currency (USD). This highly-inflationary classification results from the fact that the cumulative inflation rate for the preceding 3 year period exceeded 100 percent as of June 30, 2018. When the Company changed the functional currency, it revalued the subsidiary’s financial statements as if the new functional currency (USD) were the reporting currency. Accordingly, effective January 1, 2019, all Argentinian Peso denominated monetary assets and liabilities are considered foreign currency denominated assets and liabilities and are revalued to USD (the functional currency) with remeasurement adjustments in the period recorded in the statement of operations. The USD will be the functional currency until the economic environment in Argentina ceases to be considered highly-inflationary.
As of the date of the Business Combination, the assets and liabilities of the Argentinian subsidiary were adjusted to fair value. Certain non-monetary assets and liabilities that were previously recorded at the applicable historical exchange rates are recorded in USD using the exchange rate as of June 25, 2020. Argentinian Peso denominated monetary assets and liabilities continue to be revalued to USD (the functional currency) with remeasurement period adjustments in the period recorded in the statement of operations.
New Accounting Standards
See Note 1 to our audited consolidated financial statements for the discussion of recent accounting pronouncements.
Item 7A. Quantitative and Qualitative Disclosures About Market Risk.
The principal market risks affecting our business are exposures to interest rates on debt and foreign exchange rates.
Interest Rate Risk
We are exposed to market risk from changes in interest rates of our variable rate debt under our Loan Agreement, which consists of a Term Loan Facility and a Revolving Credit Facility. At December 31, 2022, we had $368 million and $76 million of aggregate principal amounts outstanding under our Term Loan Facility and Revolving Credit Facility, respectively.
Loans outstanding under the Term Loan Facility currently accrue interest at a rate per annum equal to 90-day SOFR subject to a floor of 1% plus a margin of 4.50% and the Revolving Credit Facility currently accrues interest at a rate per annum equal to 90-day SOFR plus a margin of 3.75%. Based on the amounts outstanding under the Term Loan Facility and Revolving Credit Facility at December 31, 2022, adding 1% to the applicable interest rate under the Term Loan Facility and Revolving Credit Facility would result in an increase of approximately $4.4 million in our annual interest expense. We currently do not use interest rate swaps to hedge the interest rate risk related to our outstanding variable rate debt.
Foreign Currency Risk
The revenues and expenses of our international operations generally are denominated in local currencies, which subject us to exchange rate fluctuations between such local currencies and the U.S. Dollar (“USD”). These exchange rate fluctuations subject us to currency translation risk with respect to the reported results of our international operations, as well as to other risks sometimes associated with international operations. In the future, we could experience fluctuations in financial results from our international operations, and there can be no assurance we will be able, contractually or otherwise, to reduce the currency risks associated with our international operations. Foreign currency risk is primarily related to operations in Europe and Asia. A 10% increase or decrease in the Swiss Franc, Euro, Chinese Yuan and British Pound Sterling against the USD would result in approximately a 4% change in our revenue for the year ended December 31, 2022. See Note 1 to our audited consolidated and combined financial statements for further information on our accounting policies for foreign currency translation.
Fluctuations in currency exchange rates may also impact our Stockholders’ Equity. Amounts invested in our foreign subsidiaries are translated into USD at the exchange rates as of the last day of each reporting period. Any resulting cumulative translation adjustments are recorded in Stockholders’ Equity as Accumulated Other Comprehensive Income (Loss). The cumulative translation adjustments component of Accumulated Other Comprehensive Income (Loss) decreased by $13.5 million for the period of December 31, 2022.
Changes in Fair Value Risk
We account for the Private Warrants in accordance with Accounting Standards Codification “ASC” Topic 815, “Derivatives and Hedging.” Under the guidance contained in ASC Topic 815-40, the Private Warrants do not meet the criteria for equity treatment and must be recorded as liabilities. Accordingly, we classify the Private Warrants as liabilities at their fair value and adjust the warrants to fair value at each reporting period. The liability is subject to re-measurement at each balance sheet date, and any change in fair value is recognized in our statement of operations. Changes in the fair value of the Private Warrants each reporting period will be adjusted through earnings, subjecting us to non-cash volatility in our results of operations.
Item 8. Financial Statements and Supplementary Data.
Report of Independent Registered Public Accounting Firm
To the Stockholders and the Board of Directors of Whole Earth Brands, Inc.
Opinion on the Financial Statements
We have audited the accompanying consolidated balance sheets of Whole Earth Brands, Inc. and subsidiaries (the Company) as of December 31, 2022 and 2021, the related consolidated and combined statements of operations, comprehensive income (loss), equity and cash flows for the year ended December 31, 2022 (Successor), December 31, 2021 (Successor), and for the periods from June 26, 2020 through December 31, 2020 (Successor) and January 1, 2020 through June 25, 2020 (Predecessor), and the related notes (collectively referred to as the “financial statements”). In our opinion, the consolidated and combined financial statements present fairly, in all material respects, the financial position of the Company at December 31, 2022 and 2021, and the results of its operations and its cash flows for the year ended December 31, 2022 (Successor), December 31, 2021 (Successor), and for the periods from June 26, 2020 through December 31, 2020 (Successor) and January 1, 2020 through June 25, 2020 (Predecessor), in conformity with U.S. generally accepted accounting principles.
Basis for Opinion
These financial statements are the responsibility of the Company’s management. Our responsibility is to express an opinion on the Company’s financial statements based on our audits. We are a public accounting firm registered with the Public Company Accounting Oversight Board (United States) (PCAOB) and are required to be independent with respect to the Company in accordance with the U.S. federal securities laws and the applicable rules and regulations of the Securities and Exchange Commission and the PCAOB.
We conducted our audits in accordance with the standards of the PCAOB. Those standards require that we plan and perform the audit to obtain reasonable assurance about whether the financial statements are free of material misstatement, whether due to error or fraud. The Company is not required to have, nor were we engaged to perform, an audit of its internal control over financial reporting. As part of our audits, we are required to obtain an understanding of internal control over financial reporting, but not for the purpose of expressing an opinion on the effectiveness of the Company’s internal control over financial reporting. Accordingly, we express no such opinion.
Our audits included performing procedures to assess the risks of material misstatement of the financial statements, whether due to error or fraud, and performing procedures that respond to those risks. Such procedures included examining, on a test basis, evidence regarding the amounts and disclosures in the financial statements. Our audits also included evaluating the accounting principles used and significant estimates made by management, as well as evaluating the overall presentation of the financial statements. We believe that our audits provide a reasonable basis for our opinion.
/s/ Ernst & Young LLP
We have served as the Company's auditor since 1987.
New York, NY
March 13, 2023
Whole Earth Brands, Inc.
Consolidated Balance Sheets
(In thousands of dollars, except for share and per share data)
| | | | | | | | | | | |
| December 31, 2022 | | December 31, 2021 |
| Assets | | | |
| Current Assets | | | |
| Cash and cash equivalents | $ | 28,676 | | | $ | 28,296 | |
Accounts receivable (net of allowances of $1,614 and $1,285, respectively) | 66,653 | | | 69,590 | |
| Inventories | 218,975 | | | 212,930 | |
| Prepaid expenses and other current assets | 10,530 | | | 7,585 | |
| Total current assets | 324,834 | | | 318,401 | |
| | | |
| Property, Plant and Equipment, net | 58,092 | | | 58,503 | |
| | | |
| Other Assets | | | |
| Operating lease right-of-use assets | 18,238 | | | 26,444 | |
| Goodwill | 193,139 | | | 242,661 | |
| Other intangible assets, net | 245,376 | | | 266,939 | |
| Deferred tax assets, net | 539 | | | 1,993 | |
| Other assets | 8,785 | | | 7,638 | |
| Total Assets | $ | 849,003 | | | $ | 922,579 | |
| | | |
| Liabilities and Stockholders’ Equity | | | |
| Current Liabilities | | | |
| Accounts payable | $ | 47,002 | | | $ | 55,182 | |
| Accrued expenses and other current liabilities | 27,488 | | | 30,733 | |
| Contingent consideration payable | — | | | 54,113 | |
| Current portion of operating lease liabilities | 8,804 | | | 7,950 | |
| Current portion of long-term debt | 3,750 | | | 3,750 | |
| Total current liabilities | 87,044 | | | 151,728 | |
| Non-Current Liabilities | | | |
| Long-term debt | 432,172 | | | 383,484 | |
| Warrant liabilities | 216 | | | 2,053 | |
| Deferred tax liabilities, net | 32,585 | | | 35,090 | |
| Operating lease liabilities, less current portion | 12,664 | | | 22,575 | |
| Other liabilities | 9,771 | | | 13,778 | |
| Total Liabilities | 574,452 | | | 608,708 | |
Commitments and Contingencies (Note 10) | — | | | — | |
| Stockholders’ Equity | | | |
Preferred shares, $0.0001 par value; 1,000,000 shares authorized; none issued and outstanding | — | | | — | |
Common stock, $0.0001 par value; 220,000,000 shares authorized; 41,994,355 and 38,871,646 shares issued and outstanding at December 31, 2022 and December 31, 2021, respectively | 4 | | | 4 | |
| Additional paid-in capital | 360,777 | | | 330,616 | |
| Accumulated deficit | (85,188) | | | (26,436) | |
| Accumulated other comprehensive (loss) income | (1,042) | | | 9,687 | |
| Total stockholders’ equity | 274,551 | | | 313,871 | |
| Total Liabilities and Stockholders’ Equity | $ | 849,003 | | | $ | 922,579 | |
See Notes to Consolidated and Combined Financial Statements
43
Whole Earth Brands, Inc.
Consolidated and Combined Statements of Operations
(In thousands of dollars, except for per share data)
| | | | | | | | | | | | | | | | | | | | | | | | | | |
| (Successor) | | | (Predecessor) |
| Year Ended December 31, 2022 | | Year Ended December 31, 2021 | | From June 26, 2020 to December 31, 2020 | | | From January 1, 2020 to June 25, 2020 |
| Product revenues, net | $ | 538,272 | | | $ | 493,973 | | | $ | 147,168 | | | | $ | 128,328 | |
| Cost of goods sold | 398,060 | | | 335,218 | | | 101,585 | | | | 77,627 | |
| Gross profit | 140,212 | | | 158,755 | | | 45,583 | | | | 50,701 | |
| | | | | | | | |
| Selling, general and administrative expenses | 99,735 | | | 113,141 | | | 44,616 | | | | 43,355 | |
| Amortization of intangible assets | 18,623 | | | 18,295 | | | 6,021 | | | | 4,927 | |
| Asset impairment charges | 46,500 | | | — | | | — | | | | 40,600 | |
| Restructuring and other expenses | — | | | 4,503 | | | 1,052 | | | | — | |
| | | | | | | | |
| Operating (loss) income | (24,646) | | | 22,816 | | | (6,106) | | | | (38,181) | |
| | | | | | | | |
| Change in fair value of warrant liabilities | 1,232 | | | 29 | | | — | | | | — | |
| Interest expense, net | (30,600) | | | (24,589) | | | (4,371) | | | | (238) | |
| Loss on extinguishment and debt transaction costs | — | | | (5,513) | | | — | | | | — | |
| Other income (expense), net | 1,051 | | | 196 | | | (578) | | | | 801 | |
| Loss before income taxes | (52,963) | | | (7,061) | | | (11,055) | | | | (37,618) | |
| Provision (benefit) for income taxes | 5,789 | | | (7,144) | | | (2,618) | | | | (3,482) | |
| Net (loss) income | $ | (58,752) | | | $ | 83 | | | $ | (8,437) | | | | $ | (34,136) | |
| | | | | | | | |
| Net (loss) earnings per share: | | | | | | | | |
| Basic | $ | (1.42) | | | $ | 0.00 | | | $ | (0.22) | | | | |
| Diluted | $ | (1.42) | | | $ | 0.00 | | | $ | (0.22) | | | | |
See Notes to Consolidated and Combined Financial Statements
44
Whole Earth Brands, Inc.
Consolidated and Combined Statements of Comprehensive Income (Loss)
(In thousands of dollars)
| | | | | | | | | | | | | | | | | | | | | | | | | | |
| (Successor) | | | (Predecessor) |
| Year Ended December 31, 2022 | | Year Ended December 31, 2021 | | From June 26, 2020 to December 31, 2020 | | | From January 1, 2020 to
June 25, 2020 |
| Net (loss) income | $ | (58,752) | | | $ | 83 | | | $ | (8,437) | | | | $ | (34,136) | |
| Other comprehensive income (loss), net of tax: | | | | | | | | |
Net change in pension benefit obligations recognized, net of taxes of $640, $26, $242, and $65, respectively. | 2,740 | | | 98 | | | 831 | | | | 318 | |
| Foreign currency translation adjustments | (13,469) | | | 984 | | | 7,774 | | | | (2,286) | |
| Total other comprehensive (loss) income, net of tax | (10,729) | | | 1,082 | | | 8,605 | | | | (1,968) | |
| Comprehensive (loss) income | $ | (69,481) | | | $ | 1,165 | | | $ | 168 | | | | $ | (36,104) | |
See Notes to Consolidated and Combined Financial Statements
45
Whole Earth Brands, Inc.
Consolidated and Combined Statements of Equity
(In thousands of dollars, except for share data)
| | | | | |
| (Predecessor) |
| Total Equity |
| |
| |
| |
| |
| Balance at December 31, 2019 | $ | 487,750 | |
| Funding to Parent, net | (11,924) | |
| Net loss | (34,136) | |
| Other comprehensive loss, net of tax | (1,968) | |
| Balance at June 25, 2020 | $ | 439,722 | |
| | | | | | | | | | | | | | | | | | | | | | | | | | | | | | | | | | | |
| Common Stock | | Additional Paid-in Capital | | Accumulated
Deficit | | Accumulated Other Comprehensive Income | | Total Stockholders’ Equity |
| Shares | | Amount | | | | |
| Balance at June 26, 2020 (Successor) | 30,926,669 | | | $ | 3 | | | $ | 250,366 | | | $ | (16,703) | | | $ | — | | | $ | 233,666 | |
| Issuance of warrants | — | | | — | | | 7,895 | | | — | | | — | | | 7,895 | |
| Issuance of common stock | 7,500,000 | | | 1 | | | 67,104 | | | — | | | — | | | 67,105 | |
| Net loss | — | | | — | | | — | | | (8,437) | | | — | | | (8,437) | |
| Other comprehensive income, net of tax | — | | | — | | | — | | | — | | | 8,605 | | | 8,605 | |
| Stock-based compensation | — | | | — | | | 1,262 | | | — | | | — | | | 1,262 | |
| Other | — | | | — | | | (948) | | | (302) | | | — | | | (1,250) | |
| Balance at December 31, 2020 (Successor) | 38,426,669 | | | 4 | | | 325,679 | | | (25,442) | | | 8,605 | | | 308,846 | |
| Reclassification of Private Warrants | — | | | — | | | (7,062) | | | (1,077) | | | — | | | (8,139) | |
| Transfer of Private Warrants to Public Warrants | — | | | — | | | 6,057 | | | — | | | — | | | 6,057 | |
| Net income | — | | | — | | | — | | | 83 | | | — | | | 83 | |
| Other comprehensive income, net of tax | — | | | — | | | — | | | — | | | 1,082 | | | 1,082 | |
| Warrant exercises | 100 | | | — | | | 1 | | | — | | | — | | | 1 | |
| Stock-based compensation | — | | | — | | | 7,854 | | | — | | | — | | | 7,854 | |
| Net share settlements of stock-based awards | 444,877 | | | — | | | (1,913) | | | — | | | — | | | (1,913) | |
| Balance at December 31, 2021 (Successor) | 38,871,646 | | | 4 | | | 330,616 | | | (26,436) | | | 9,687 | | | 313,871 | |
| Transfer of Private Warrants to Public Warrants | — | | | — | | | 605 | | | — | | | — | | | 605 | |
| Net loss | — | | | — | | | — | | | (58,752) | | | — | | | (58,752) | |
| Other comprehensive loss, net of tax | — | | | — | | | — | | | — | | | (10,729) | | | (10,729) | |
| | | | | | | | | | | |
| Stock-based compensation | — | | | — | | | 4,636 | | | — | | | — | | | 4,636 | |
| Net share settlements of stock-based awards | 259,372 | | | — | | | (418) | | | — | | | — | | | (418) | |
| Net share settlements under management bonus plan | 203,763 | | | — | | | 1,402 | | | — | | | — | | | 1,402 | |
| Shares issued for payment of contingent consideration | 2,659,574 | | | — | | | 23,936 | | | — | | | — | | | 23,936 | |
| Balance at December 31, 2022 (Successor) | 41,994,355 | | | $ | 4 | | | $ | 360,777 | | | $ | (85,188) | | | $ | (1,042) | | | $ | 274,551 | |
See Notes to Consolidated and Combined Financial Statements
46
Whole Earth Brands, Inc.
Consolidated and Combined Statements of Cash Flows
(In thousands of dollars)
| | | | | | | | | | | | | | | | | | | | | | | | | | |
| (Successor) | | | (Predecessor) |
| Year Ended December 31, 2022 | | Year Ended December 31, 2021 | | From June 26, 2020 to December 31, 2020 | | | From January 1, 2020 to
June 25, 2020 |
| Operating activities | | | | | | | | |
| Net (loss) income | $ | (58,752) | | | $ | 83 | | | $ | (8,437) | | | | $ | (34,136) | |
| Adjustments to reconcile net (loss) income to net cash provided by operating activities: | | | | | | | | |
| Stock-based compensation | 4,933 | | | 8,715 | | | 1,262 | | | | — | |
| Depreciation | 6,001 | | | 4,727 | | | 1,652 | | | | 1,334 | |
| Amortization of intangible assets | 18,623 | | | 18,295 | | | 6,021 | | | | 4,927 | |
| Deferred income taxes | (456) | | | (12,300) | | | (2,842) | | | | (5,578) | |
| Asset impairment charges | 46,500 | | | — | | | — | | | | 40,600 | |
| Amortization of inventory fair value adjustments | (2,537) | | | (3,396) | | | 12,613 | | | | — | |
| Non-cash loss on extinguishment of debt | — | | | 4,435 | | | — | | | | — | |
| Amortization of debt issuance costs and original issue discount | 1,982 | | | 1,783 | | | 762 | | | | — | |
| Change in fair value of warrant liabilities | (1,232) | | | (29) | | | — | | | | — | |
| Changes in current assets and liabilities: | | | | | | | | |
| Accounts receivable | 1,222 | | | 964 | | | (4,554) | | | | 7,726 | |
| Inventories | (7,684) | | | (22,957) | | | (5,305) | | | | 3,576 | |
| Prepaid expenses and other current assets | 201 | | | (1,030) | | | (2,066) | | | | 3,330 | |
| Accounts payable, accrued liabilities and income taxes | (11,574) | | | 12,050 | | | (7,939) | | | | 507 | |
| Other, net | (3,037) | | | (1,858) | | | (612) | | | | (2,378) | |
| Net cash (used in) provided by operating activities | (5,810) | | | 9,482 | | | (9,445) | | | | 19,908 | |
| | | | | | | | |
| Investing activities | | | | | | | | |
| Capital expenditures | (8,887) | | | (12,198) | | | (4,489) | | | | (3,532) | |
| Acquisitions, net of cash acquired | — | | | (190,231) | | | (456,508) | | | | — | |
| Proceeds from sale of fixed assets | 468 | | | 4,516 | | | — | | | | — | |
| Transfer from trust account | — | | | — | | | 178,875 | | | | — | |
| Net cash used in investing activities | (8,419) | | | (197,913) | | | (282,122) | | | | (3,532) | |
| | | | | | | | |
| Financing activities | | | | | | | | |
| Proceeds from revolving credit facility | 54,000 | | | 25,000 | | | 47,855 | | | | 3,500 | |
| Repayments of revolving credit facility | (3,000) | | | (47,855) | | | — | | | | (8,500) | |
| Long-term borrowings | — | | | 375,000 | | | 140,000 | | | | — | |
| Repayments of long-term borrowings | (3,750) | | | (139,314) | | | (3,500) | | | | — | |
| Debt issuance costs | (719) | | | (11,589) | | | (7,139) | | | | — | |
| Payment of contingent consideration | (29,108) | | | — | | | — | | | | — | |
| Proceeds from sale of common stock and warrants | — | | | 1 | | | 75,000 | | | | — | |
| Tax withholdings related to net share settlements of stock-based awards | (898) | | | (1,913) | | | — | | | | — | |
| Funding to Parent, net | — | | | — | | | — | | | | (11,924) | |
| Net cash provided by (used in) financing activities | 16,525 | | | 199,330 | | | 252,216 | | | | (16,924) | |
See Notes to Consolidated and Combined Financial Statements
47
Whole Earth Brands, Inc.
Consolidated and Combined Statements of Cash Flows (Continued)
(In thousands of dollars)
| | | | | | | | | | | | | | | | | | | | | | | | | | |
| (Successor) | | | (Predecessor) |
| Year Ended December 31, 2022 | | Year Ended December 31, 2021 | | From June 26, 2020 to December 31, 2020 | | | From January 1, 2020 to
June 25, 2020 |
| | | | | | | | |
| Effect of exchange rate changes on cash and cash equivalents | (1,916) | | | 499 | | | 714 | | | | 215 | |
| Net change in cash and cash equivalents | 380 | | | 11,398 | | | (38,637) | | | | (333) | |
| Cash and cash equivalents, beginning of period | 28,296 | | | 16,898 | | | 55,535 | | | | 10,395 | |
| Cash and cash equivalents, end of period | $ | 28,676 | | | $ | 28,296 | | | $ | 16,898 | | | | $ | 10,062 | |
| | | | | | | | |
| Supplemental disclosure of cash flow information | | | | | | | | |
| Interest paid | $ | 28,386 | | | $ | 21,203 | | | $ | 3,328 | | | | $ | 798 | |
| Taxes paid, net of refunds | $ | 9,113 | | | $ | 4,523 | | | $ | 3,091 | | | | $ | 2,244 | |
| Supplemental disclosure of non-cash investing | | | | | | | | |
| Non-cash capital expenditures | $ | — | | | $ | 3,796 | | | $ | — | | | | $ | — | |
See Notes to Consolidated and Combined Financial Statements
48
Whole Earth Brands, Inc.
Notes to Consolidated and Combined Financial Statements
NOTE 1: BASIS OF PRESENTATION AND SIGNIFICANT ACCOUNTING POLICIES
Whole Earth Brands, Inc. and its consolidated subsidiaries (“Whole Earth Brands” or the “Company”) is a global industry-leading platform, focused on the “better for you” consumer packaged goods (“CPG”) and ingredients space. The Company has a global platform of branded products and ingredients, focused on the consumer transition towards natural alternatives and clean label products.
On June 24, 2020, Act II Global Acquisition Corp., a Cayman Islands exempted company (“Act II”), domesticated into a Delaware corporation (the “Domestication”), and on June 25, 2020 (the “Closing”), consummated the indirect acquisition (the “Business Combination”) of (i) all of the issued and outstanding equity interests of Merisant Company (“Merisant”), Merisant Luxembourg Sarl (“Merisant Luxembourg”), Mafco Worldwide LLC (“Mafco Worldwide”), Mafco Shanghai LLC (“Mafco Shanghai”), EVD Holdings LLC (“EVD Holdings”), and Mafco Deutschland GmbH (together with Merisant, Merisant Luxembourg, Mafco Worldwide, Mafco Shanghai, and EVD Holdings, and their respective direct and indirect subsidiaries, “Merisant and Mafco Worldwide”), and (ii) certain assets and liabilities of Merisant and Mafco Worldwide included in the Transferred Assets and Liabilities (as defined in the Purchase Agreement (as hereafter defined)), from Flavors Holdings Inc. (“Flavors Holdings”), MW Holdings I LLC (“MW Holdings I”), MW Holdings III LLC (“MW Holdings III”), and Mafco Foreign Holdings, Inc. (“Mafco Foreign Holdings,” and together with Flavors Holdings, MW Holdings I, and MW Holdings III, the “Sellers”), pursuant to that certain Purchase Agreement (the “Purchase Agreement”) entered into by and among Act II and the Sellers dated as of December 19, 2019, as amended. In connection with the Domestication, Act II changed its name to “Whole Earth Brands, Inc.”
Upon the completion of the Domestication, each of Act II’s then-issued and outstanding ordinary shares converted, on a one-for-one basis, into shares of common stock of Whole Earth Brands. Additionally, immediately after the Business Combination, the Company issued an aggregate of 7,500,000 shares of Whole Earth Brands common stock and 5,263,500 private placement warrants exercisable for 2,631,750 shares of Whole Earth Brands common stock to certain investors. On the date of Closing, the Company’s common stock and warrants began trading on The Nasdaq Stock Market under the symbols “FREE” and “FREEW,” respectively.
As a result of the Business Combination, for accounting purposes, Act II was deemed to be the acquirer and Mafco Worldwide and Merisant Company were deemed to be the acquired parties and, collectively, the accounting predecessor. The Company’s financial statement presentation includes the combined financial statements of Mafco Worldwide and Merisant Company as the “Predecessor” for periods prior to the completion of the Business Combination and includes the consolidation of Mafco Worldwide and Merisant Company, for periods after the Closing (referred to as the “Successor”). The combined financial statements for the “Predecessor” periods include the accounts of Mafco Worldwide and Merisant Company which were wholly owned subsidiaries of Flavors Holdings Inc. Flavors Holdings Inc. is an indirect, wholly owned subsidiary of MacAndrews & Forbes Incorporated, which was not acquired in the Business Combination.
Principles of Consolidation—The consolidated and combined financial statements include the accounts of Whole Earth Brands, Inc., and its indirect and wholly owned subsidiaries. All significant intercompany accounts and transactions have been eliminated in consolidation.
Use of Estimates—The preparation of financial statements in conformity with U.S. GAAP requires management to make estimates and assumptions that affect the amounts reported in the consolidated and combined financial statements and accompanying notes. Actual results could differ from these estimates.
Reclassifications—Certain previously reported amounts have been reclassified to conform to the current presentation.
Cash and Cash Equivalents—The Company considers all cash on hand, money market funds, and other highly liquid debt instruments with a maturity, when purchased, of three months or less to be cash and cash equivalents.
Accounts Receivable and Allowance for Doubtful Accounts—Trade accounts receivable are recorded at the invoiced amount and do not bear interest. The allowance for doubtful accounts is the Company’s best estimate of the amount of probable losses in its existing accounts receivable based on historical losses and current economic conditions. Account balances are charged against the allowance when the Company believes it is probable the receivable will not be recovered. The Company does not have any off-balance sheet credit exposure related to its customers. Recoveries of accounts receivable previously offset against the allowance are recorded in the combined statements of operations when received.
Whole Earth Brands, Inc.
Notes to Consolidated and Combined Financial Statements
A summary of the activity with respect to the accounts receivable allowances is as follows (in thousands):
| | | | | |
| Accounts receivable allowance balance at December 31, 2019 (Predecessor) | $ | 2,833 | |
| January 1, 2020 to June 25, 2020 additions charged to revenues, costs and expenses | 759 | |
| January 1, 2020 to June 25, 2020 deductions and other | (2,148) | |
| Accounts receivable allowance balance at June 25, 2020 (Predecessor) | $ | 1,444 | |
| June 26, 2020 to December 31, 2020 additions charged to revenues, costs and expenses | 709 | |
| June 26, 2020 to December 31, 2020 deductions and other | (1,198) | |
| Accounts receivable allowance balance at December 31, 2020 (Successor) | $ | 955 | |
| 2021 additions charged to revenues, costs and expenses | 1,783 | |
| 2021 deductions and other | (1,453) | |
| Accounts receivable allowance balance at December 31, 2021 (Successor) | $ | 1,285 | |
| 2022 additions charged to revenues, costs and expenses | 2,711 | |
| 2022 deductions and other | (2,382) | |
| Accounts receivable allowance balance at December 31, 2022 (Successor) | $ | 1,614 | |
Inventories—Inventories are stated at the lower of cost or net realizable value. Net realizable value is the estimated selling price in the ordinary course of business less reasonably predicable costs of completion, disposal, and transportation. The cost of inventory is determined by the first in, first out or average cost methods.
Property, Plant and Equipment—Property, plant and equipment are recorded at cost. Additions, improvements, and replacements that extend asset life are capitalized. Depreciation is computed using the straight-line method over the estimated useful lives of the assets. The estimated useful lives of the Company’s property, plant and equipment in service currently ranges as follows: 3 to 40 years for buildings and 1 to 20 years for all other equipment.
When property and equipment are disposed of, the related cost and accumulated depreciation are removed from the respective accounts, and any gains or losses are included in income from operations. Ordinary repairs and maintenance costs are charged to operating expense as incurred.
Deferred Software Costs—Deferred implementation costs for hosted cloud computing service arrangements are stated at historical cost and amortized on a straight-line basis over the term of the hosting arrangement that the implementation costs relate to. Deferred implementation costs are included in other assets and amortized to selling, general and administrative expenses (“SG&A”). The corresponding cash flows related to deferred software costs will be reported within operating activities consistent with the treatment for payments associated with the service component of the hosting arrangement. The Company reviews the deferred implementation costs for impairment when it believes the deferred costs may no longer be recoverable. As of December 31, 2022 and 2021, deferred software costs associated with cloud computing arrangements were $2.1 million and $1.0 million, respectively. No costs were amortized during 2022 or 2021.
Leases—As of the date of the Business Combination, the Company accounts for leases pursuant to Accounting Standards Codification (“ASC”) Topic 842, “Leases.” Under ASC Topic 842, a right-of-use asset and a lease liability is recorded for all leases with a term greater than 12 months. Lease right-of-use assets and lease liabilities are initially recognized based on the present value of the future minimum lease payments over the lease term at commencement date calculated using our incremental borrowing rate applicable to the lease asset, unless the implicit rate is readily determinable.
The Company’s lease portfolio includes a factory building, office space, warehouses, material handling equipment, vehicles and office equipment. All of our leases are classified as operating leases.
Goodwill and Other Indefinite-Lived Intangible Assets—Goodwill and other indefinite-lived intangible assets are summarized in Note 6. The Company reviews goodwill and other indefinite-lived intangible assets for impairment annually, or more frequently if events or changes in circumstances indicate that an asset may be impaired, in accordance with ASC Topic 350, “Intangibles—Goodwill and Other.” Under ASC Topic 350, the impairment review of goodwill and other intangible assets not subject to amortization must be based on estimated fair values.
Whole Earth Brands, Inc.
Notes to Consolidated and Combined Financial Statements
The Company’s annual impairment review measurement date is in the fourth quarter of each year. In performing the annual assessment, the Company has the option of performing a qualitative assessment to determine if it is more likely than not that a reporting unit has been impaired. As part of the qualitative assessment for the reporting units, the Company evaluates the factors that are specific to the reporting units as well as industry and macroeconomic factors (including changes in interest and discount rates). The reporting unit specific factors may include cost factors, a comparison of current year results to prior year, current year budget and future projected financial performance. The Company also considers the change in the overall enterprise value of the Company compared to the prior year.
If the Company determines that it is more likely than not that a reporting unit is impaired or if the Company elects not to perform the optional qualitative assessment, a quantitative assessment is performed utilizing both the income and market approaches to estimate the fair value of its reporting units. The income approach involves discounting future estimated cash flows. The discount rate used is the value-weighted average of the reporting unit’s estimated cost of equity and debt (“cost of capital”) derived using both known and estimated customary market metrics adjusted for company specific risks. The Company performs sensitivity tests with respect to growth rates and discount rates used in the income approach. In applying the market approach, valuation multiples are derived from historical and projected operating data of selected guideline companies; evaluated and adjusted, if necessary, based on the strengths and weaknesses of the reporting unit relative to the selected guideline companies; and applied to the appropriate historical and/or projected operating data to arrive at an indication of fair value. The Company typically weights the results of the income and market approaches equally. If the reporting unit’s carrying value exceeds its estimated fair value, then an impairment is recorded for the difference, limited to the total amount of goodwill allocated to the reporting unit.
The Company typically evaluates impairment of indefinite-lived intangible assets, which relates to our product formulations, by first performing a qualitative assessment. If the Company elects to bypass the qualitative assessment or determines that it is more likely than not that the fair value of the product formulations is less than its carrying value, a quantitative assessment is then performed using the relief from royalty method under the income approach to estimate the fair value. Some of the more significant assumptions inherent in estimating the fair value include the estimated future annual sales, royalty rates (as a percentage of sales that would hypothetically be charged by a licensor of the brand to an unrelated licensee), income tax considerations and a discount rate that reflects the level of risk.
Impairment Review of Long-Lived Assets—In accordance with ASC Topic 360, “Property, Plant and Equipment,” the Company evaluates the carrying value of long-lived assets to be held and used whenever events or changes in circumstances indicate that the carrying amount of a long-lived asset or asset group may be impaired. When such events occur, the Company compares the sum of the future undiscounted cash flows expected to be generated from the asset or asset group over its remaining depreciable life to the carrying value. If this comparison indicates that there is an impairment, the carrying amount of the long-lived asset would then be reduced to the estimated fair value, which generally approximates discounted cash flows. The Company also evaluates the amortization periods of assets to determine whether events or circumstances warrant revised estimates of useful lives. The Company’s applicable long-lived assets include its property, plant and equipment, operating lease right-of-use assets and definite-lived intangible assets.
Income Taxes—The provision for income taxes for the Successor period is determined using the asset and liability method in accordance with ASC Topic 740, “Accounting for Income Taxes.” The asset and liability method provides that deferred tax assets and liabilities are recognized for the expected future tax consequences of temporary differences between the financial reporting and tax bases of assets and liabilities and for operating loss and tax credit carry forwards. Deferred tax assets and liabilities are measured using the currently enacted tax rates and laws that will be in effect when the differences are expected to reverse. The Company records a valuation allowance to reduce deferred tax assets to the amount that is believed more likely than not to be realized.
For the Predecessor period, income taxes as presented herein are attributable to current and deferred income taxes of the Company’s financial statements in a manner that is systematic, rational, and consistent with the asset and liability method described by ASC Topic 740. Accordingly, the Company’s income tax provision during the Predecessor period was prepared following the separate return method. The separate return method applies ASC Topic 740 to the stand-alone financial statements of each member of the combined group as if the group member were a separate taxpayer and a stand-alone enterprise. Use of the separate return method may result in differences when the sum of the amounts allocated to stand-alone tax provisions are compared with amounts presented in the combined financial statements. In that event, the related deferred tax assets and liabilities could be significantly different from those presented herein. The combined financial statements reflect the Company’s portion of income taxes payable as if the Company had been a separate taxpayer.
Whole Earth Brands, Inc.
Notes to Consolidated and Combined Financial Statements
The Company made a policy election to treat the income tax due on United States (“U.S.”) inclusion of the global intangible low taxed income (“GILTI”) provisions as a period expense when incurred.
Uncertainty in Income Taxes—The Company accounts for uncertain tax positions in accordance with the authoritative guidance issued under ASC Topic 740, which addresses the determination of whether tax benefits claimed or expected to be claimed on a tax return should be recorded in the financial statements. The Company may recognize the tax benefit from an uncertain tax position only if it is more likely than not that the tax position will be sustained on examination by the taxing authorities based on the technical merits of the position. The tax benefits recognized in the financial statements from such position should be measured based on the largest benefit that has a greater than fifty percent likelihood of being realized upon ultimate settlement. The Company provides loss contingencies for federal, state and international tax matters relating to potential tax examination issues, planning initiatives and compliance responsibilities. The development of these reserves requires judgements about tax issues, potential outcomes and timing, which if different, may materially impact the Company’s financial condition and results of operations. The Company classifies interest and penalties associated with income taxes as a component of provision (benefit) for income taxes in the consolidated and combined statements of operations.
Pension Plans—The Company has defined benefit pension plans and defined contribution 401(k) plans, which cover certain current and former employees of the Company who meet eligibility requirements. Benefits for the defined benefit pension plans are based on years of service and, in some cases, the employee’s compensation and participation was frozen to all employees hired on or after August 1, 2017. The Company’s policy is to contribute annually the amount required pursuant to the Employee Retirement Income Security Act. The Company froze the qualified pension plan for all participants on December 31, 2019 and froze the non-qualified pension plans on December 31, 2022. Certain subsidiaries of the Company outside the U.S. have retirement plans that provide certain payments upon retirement. The Company recognizes in its balance sheet the funded status of its defined benefit pension plans, measured as the difference between the fair value of the plan assets and the benefit obligation and recognizes changes in the funded status of the defined benefit pension plans as accumulated other comprehensive loss, net of tax, within accumulated other comprehensive income (loss) to the extent such changes are not recognized in earnings as components of periodic net benefit cost (see Note 12). These amounts are subsequently amortized within other income (expense) in future periods using the corridor approach. The corridor is 10% of the greater of the market-related value of the plan’s assets or projected benefit obligation. Any actuarial gains and losses in excess of the corridor are then amortized over an appropriate term.
Research and Development Costs—The Company expenses costs as incurred for product research and development within SG&A. Research and development expenses were approximately $3.9 million for 2022, $3.4 million for 2021, $1.6 million for the period from June 26, 2020 to December 31, 2020, and $1.7 million for the period from January 1, 2020 to June 25, 2020.
Stock-Based Compensation—In accordance with ASC Topic 718, “Compensation—Stock Compensation,” the Company recognizes stock-based compensation cost in its consolidated statements of operations. Stock-based compensation cost is measured at the grant date for equity-classified awards and at the end of each reporting period for liability-classified awards based on the estimated fair value of the awards. The Company recognizes stock-based compensation expense on a straight-line basis over the requisite service period. Additional information pertaining to the Company’s stock-based compensation is provided in Note 13.
Revenue Recognition—In accordance with ASC Topic 606, “Revenue from Contracts with Customers,” the Company recognizes revenue when control of the promised goods or services is transferred to the customers, in an amount that reflects the consideration the Company expects to be entitled to in exchange for those goods or services. Revenues are primarily derived from customer orders for the purchase of products and are generally recognized when the product is shipped or delivered depending on the arrangement with the customer. The Company made an accounting policy election to exclude from the measurement of the transaction price sales taxes and all other items of a similar nature, and also elected to account for shipping and handling activities as a fulfillment of the promise to transfer the goods. Accordingly, shipping and handling costs are included in cost of sales.
Branded CPG may offer promotional activities (e.g. coupons, trade discounts and other promotional activities) to its customers. These variable consideration amounts are estimated for each customer based on specific arrangements/agreements, an analysis of historical volume, and/or current activity with that customer. Reassessment of variable
Whole Earth Brands, Inc.
Notes to Consolidated and Combined Financial Statements
consideration estimates is done at each reporting date throughout the contract period until the uncertainty is resolved (e.g. promotional campaign is closed and settled with customer).
Historically, the Company has encountered limited instances whereby customers rejected products as a result of orders being materially inaccurate and/or products being defective. The Company tracks the reason codes for those customer returns. Based on that, the materiality of such returns is assessed. A return reserve is calculated (based on historical data as described above) every month to record an adjustment to net sales; these adjustments have not been significant.
The following table presents the Company’s revenues disaggregated by product categories (in thousands):
| | | | | | | | | | | | | | | | | | | | | | | | | | |
| (Successor) | | | (Predecessor) |
| Year Ended December 31, 2022 | | Year Ended December 31, 2021 | | From June 26, 2020 to December 31, 2020 | | | From January 1, 2020 to
June 25, 2020 |
| Sweeteners and adjacencies | $ | 422,638 | | | $ | 389,174 | | | $ | 96,857 | | | | $ | 80,749 | |
| Licorice products | 115,634 | | | 104,799 | | | 50,311 | | | | 47,579 | |
| Total product revenues, net | $ | 538,272 | | | $ | 493,973 | | | $ | 147,168 | | | | $ | 128,328 | |
The following table presents revenues disaggregated by business and geographic region (in thousands):
| | | | | | | | | | | | | | | | | | | | | | | | | | |
| (Successor) | | | (Predecessor) |
| Year Ended December 31, 2022 | | Year Ended December 31, 2021 | | From June 26, 2020 to December 31, 2020 | | | From January 1, 2020 to
June 25, 2020 |
| Branded CPG: | | | | | | | | |
| North America | $ | 299,871 | | | $ | 266,661 | | | $ | 40,273 | | | | $ | 29,926 | |
| Europe | 67,962 | | | 76,392 | | | 35,384 | | | | 31,838 | |
| India, Middle East and Africa | 17,828 | | | 13,363 | | | 6,727 | | | | 3,778 | |
| Asia-Pacific | 22,371 | | | 20,787 | | | 8,172 | | | | 9,328 | |
| Latin America | 14,606 | | | 11,971 | | | 6,301 | | | | 5,879 | |
| Flavors & Ingredients | 115,634 | | | 104,799 | | | 50,311 | | | | 47,579 | |
| Total product revenues, net | $ | 538,272 | | | $ | 493,973 | | | $ | 147,168 | | | | $ | 128,328 | |
The Company records an allowance for doubtful accounts as an estimate of the inability of its customers to make their required payments. The determination of the allowance requires the Company to make assumptions about the future ability to collect amounts owed from customers.
Marketing, Advertising, Consumer Incentives and Trade Promotions—The Company promotes its products with marketing activities, including advertising, consumer incentives and trade promotions. On an annual basis, advertising costs are expensed as incurred or in the year in which the related advertisement initially appears. Marketing and advertising expense was $11.8 million in 2022, $17.0 million in 2021, $6.2 million for the period from June 26, 2020 through December 31, 2020, and $4.8 million from January 1, 2020 through June 25, 2020.
Consumer incentive and trade promotion activities are deducted from revenue based on amounts estimated as being or becoming due to customers and consumers at the end of a period, based principally on the Company’s historical utilization and redemption rates. These deductions are estimated and recorded upon sale of product by the Company and revised as necessary at each period end.
Fair Value Measurements—The Company measures fair value using a three-tier fair value hierarchy, which prioritizes the inputs used in measuring fair value. These tiers include: Level 1, defined as observable inputs such as quoted prices in active markets; Level 2, defined as inputs other than quoted prices in active markets that are either directly or indirectly observable; and Level 3, defined as unobservable inputs in which little or no market data exists, therefore requiring an entity to develop its own assumptions.
In instances where the determination of the fair value measurement is based on inputs from different levels of the fair value hierarchy, the level in the fair value hierarchy within which the entire fair value measurement falls is based on the
Whole Earth Brands, Inc.
Notes to Consolidated and Combined Financial Statements
lowest level input that is significant to the fair value measurement in its entirety. The Company’s assessment of the significance of a particular input to the fair value measurement in its entirety requires judgment and considers factors specific to the asset or liability.
Major Customers and Credit Concentration—The Company sells products to customers in the U.S. and internationally. The Company performs ongoing credit evaluations of customers, and generally does not require collateral on trade accounts receivable. Allowances are maintained for potential credit losses and such losses have been within management’s expectations.
Foreign Currency Translation—The Company has determined that the functional currency for each combined subsidiary is its local currency, except for certain entities whose functional currency is the U.S. dollar. Assets and liabilities of entities outside the U.S. are translated into U.S. dollars at the exchange rates in effect at the end of each period and income statement accounts are translated at each period’s average exchange rate. Translation adjustments arising from the use of differing exchange rates from period to period are included as a component of accumulated other comprehensive income (loss) on the balance sheet, except for any entities which may operate in highly inflationary economies. Gains and losses resulting from transactions in other than functional currencies are reflected in operating results, except for transactions of a long-term nature.
Remeasurements of European entities whose functional currency is the U.S. dollar as well as translation adjustments for entities operating in highly inflationary economies and impacts of foreign currency transactions are recognized currently in other income (expense), net in the accompanying consolidated and combined statements of operations. The Company had foreign exchange gains, net of $0.1 million in 2022, foreign exchange losses, net of $0.2 million in 2021, $0.9 million for the period from June 26, 2020 through December 31, 2020, and foreign exchange gains, net of $0.5 million from January 1, 2020 through June 25, 2020.
Beginning January 1, 2019, the Company was required to apply highly-inflationary accounting to its Argentinian subsidiary. This accounting treatment requires a change in the subsidiary’s functional currency from the local currency (Argentinian Peso) to the parent’s reporting currency (USD). This highly-inflationary classification results from the fact that the cumulative inflation rate for the preceding 3 year period exceeded 100 percent as of June 30, 2018. Accordingly, effective January 1, 2019, all Argentinian Peso denominated monetary assets and liabilities are considered foreign currency denominated assets and liabilities and are revalued to USD (the functional currency) with remeasurement adjustments in the period recorded in the statement of operations. The USD will be the functional currency until the economic environment in Argentina ceases to be considered highly-inflationary.
The Company recorded $1.2 million of expense related to remeasurement adjustments in the consolidated statements of operations for the year ended December 31, 2022 and $0.3 million of expense for both the year ended December 31, 2021 and the period of June 26, 2020 to December 31, 2020. The impact was not material for the period of January 1, 2020 to June 25, 2020.
Restructuring and Employee Termination Benefits—In previous years the Company adopted restructuring plans to streamline processes and realize cost savings by consolidating facilities and eliminating various positions in operations and general and administrative areas.
In connection with the restructuring plans, the Company recognized restructuring and other expenses of $4.5 million and $1.1 million during the year ended December 31, 2021 and for the period from June 26, 2020 to December 31, 2020, respectively. This included facility exit and other related costs of $3.9 million in 2021, and employee termination benefits of $0.6 million in 2021 and $1.1 million for the period from June 26, 2020 to December 31, 2020. In 2022, the Company paid employee termination benefits of $0.8 million. The Company had no accrued severance expense related to the restructuring plans as of December 31, 2022 and $0.8 million at December 31, 2021.
Termination benefits are payable when an employee is involuntarily terminated, or whenever an employee accepts voluntary termination in exchange for termination benefits. One-time involuntary termination benefits are recognized as a liability when the termination plan meets certain criteria and has been communicated to employees. If employees are required to render future service in order to receive these one-time termination benefits, the liability is recognized ratably over the future service period.
Warrant Liabilities—The Company accounts for the Private Warrants in accordance with ASC Topic 815, “Derivatives and Hedging.” Under the guidance contained in ASC Topic 815-40, the Private Warrants do not meet the criteria for equity treatment and must be recorded as liabilities. Accordingly, the Company classifies the Private Warrants as liabilities at their
Whole Earth Brands, Inc.
Notes to Consolidated and Combined Financial Statements
fair value and adjusts the warrants to fair value at each reporting period. The liability is subject to re-measurement at each balance sheet date, and any change in fair value is recognized in the Company’s statement of operations. The Private Warrants are valued using a Black-Scholes option pricing model.
Based on the views expressed in the SEC’s Staff Statement of April 12, 2021 in which the SEC staff clarified its interpretations of certain generally accepted accounting principles related to certain terms common in warrants issued by Special Purpose Acquisition Companies (“SPACs”), the Company determined that the Private Warrants should be treated as derivative liabilities rather than as components of equity, as previously presented as of December 31, 2020. Accordingly, the Company recorded out of period adjustments at January 1, 2021 to reclassify warrant liabilities of $8.1 million and transaction costs incurred by Act II of $1.1 million related to the issuance of the Private Warrants. Additionally, during the first quarter of 2021, the Company recognized the cumulative effect of the error on prior periods by recording a $1.2 million gain in the Statement of Operations to reflect the cumulative decrease in the fair value of the Private Warrants from the date of issuance through December 31, 2020. The Company concluded that this misstatement was not material to the current period or the previously filed financial statements.
Accounting Standards Adopted in the Current Year—The Company qualifies as an emerging growth company (an “EGC”) and as such, has elected the extended transition period for complying with certain new or revised accounting pronouncements. During the extended transition period, the Company is not subject to certain new or revised accounting standards applicable to public companies. The accounting pronouncements pending adoption below reflect effective dates for the Company as an EGC with the extended transition period.
In December 2019, the FASB issued ASU 2019-12, “Income Taxes (ASC 740) - Simplifying the Accounting for Income Taxes.” The standard removes certain exceptions related to the approach for intra-period tax allocation, the methodology for calculating income taxes in an interim period and the recognition of deferred tax liabilities for outside basis difference. The standard also enhances and simplifies various aspects of the income tax accounting guidance. For public entities, the standard is effective for annual periods and interim periods beginning after December 15, 2020. This standard is effective for the Company as an EGC for the fiscal years beginning after December 15, 2021. Early adoption is permitted. The Company adopted this standard on January 1, 2022. The adoption of this standard did not have a material impact on the Company’s audited consolidated and combined financial statements and related disclosures.
In March 2020, the FASB issued ASU 2020-4, “Reference Rate Reform (Topic 848): Facilitation of the Effects of Reference Rate Reform on Financial Reporting.” Subject to meeting certain criteria, the new guidance provides optional expedients and exceptions to applying contract modification accounting under existing U.S. GAAP, to address the expected phase out of the London Inter-bank Offered Rate (“LIBOR”) by the end of 2021. The amendments in ASU 2020-4 apply only to contracts, hedging relationships, and other transactions that reference LIBOR or another reference rate expected to be discontinued because of reference rate reform. The new standard was effective upon issuance and upon adoption can be applied prospectively to applicable contract modifications made on or before December 31, 2022. The Company adopted this standard during the second quarter of 2022. The adoption of this standard did not have a material impact on the Company’s consolidated and combined financial statements and related disclosures.
Accounting Standards Not Yet Adopted—In June 2016, the FASB issued ASU 2016-13, “Financial Instruments - Credit Losses (Topic 326).” The standard requires entities to estimate losses on financial assets measured at amortized cost, including trade receivables, debt securities and loans, using an expected credit loss model. The expected credit loss differs from the previous incurred losses model primarily in that the loss recognition threshold of “probable” has been eliminated and that expected loss should consider reasonable and supportable forecasts in addition to the previously considered past events and current conditions. Additionally, the guidance requires additional disclosures related to the further disaggregation of information related to the credit quality of financial assets by year of the asset’s origination for as many as five years. Entities must apply the standard provision as a cumulative-effect adjustment to retained earnings as of the beginning of the first reporting period in which the guidance is effective. This standard is effective for the Company as an EGC for fiscal years beginning after December 15, 2022 including interim periods within those fiscal years. The Company is currently evaluating the impact of adopting ASU 2016-13 on its consolidated financial statements.
Whole Earth Brands, Inc.
Notes to Consolidated and Combined Financial Statements
NOTE 2: BUSINESS COMBINATIONS
Swerve Acquisition—On November 10, 2020, the Company executed and closed a definitive Equity Purchase Agreement (the “Purchase Agreement”) with RF Development, LLC (“RF Development”), Swerve, L.L.C. (“Swerve LLC”) and Swerve IP, L.L.C. (“Swerve IP” and together with Swerve LLC, “Swerve”). Swerve is a manufacturer and marketer of a portfolio of zero and reduced sugar, keto-friendly, and plant-based sweeteners and grain free, gluten free and low/no sugar baking mixes. The Company purchased all of the issued and outstanding equity interests of both Swerve LLC and Swerve IP from RF Development for $80 million in cash, subject to customary post-closing adjustments. The transaction was funded through a combination of available cash on hand and approximately $47.9 million under the Company’s $50 million revolving loan facility. In connection with the acquisition of Swerve, the Company incurred transaction-related costs of $0.3 million and $3.2 million for the years ended December 31, 2021 and December 31, 2020, respectively. Swerve is included within the Company’s Branded CPG reportable segment. Swerve’s results are included in the Company’s consolidated statement of operations from the date of acquisition.
The following summarizes the purchase consideration (in thousands):
| | | | | |
| Base cash consideration | $ | 80,000 | |
| Closing adjustment | (968) | |
| Total Purchase Price | $ | 79,032 | |
The Company recorded the fair value of the purchase price to tangible and identifiable intangible assets acquired and liabilities assumed as follows (in thousands):
| | | | | |
| |
| Accounts receivable | $ | 3,223 | |
| Inventories | 6,824 | |
| Prepaid expenses and other current assets | 223 | |
| Property, plant and equipment, net | 143 | |
| Operating lease right-of-use assets | 76 | |
| Intangible assets | 36,300 | |
| |
| Other assets | 3 | |
| Total assets acquired | 46,792 | |
| Accounts payable | 3,477 | |
| Accrued expenses and other current liabilities | 288 | |
| Current portion of operating lease liabilities | 48 | |
| Operating lease liabilities, less current portion | 28 | |
| |
| |
| Total liabilities assumed | 3,841 | |
| Net assets acquired | 42,951 | |
| Goodwill | 36,081 | |
| Total Purchase Price | $ | 79,032 | |
The values allocated to identifiable intangible assets and their estimated useful lives are as follows:
| | | | | | | | | | | |
| Identifiable intangible assets | Fair Value (in thousands) | | Useful Life (in years) |
| Customer relationships | $ | 3,200 | | | 10 |
| Tradenames | 33,100 | | | 25 |
| $ | 36,300 | | | |
Goodwill represents the excess of the purchase price over the estimated fair value assigned to tangible and identifiable intangible assets acquired and liabilities assumed and represents the future economic benefits expected to arise from other intangible assets acquired that do not qualify for separate recognition, including assembled workforce and expected future market opportunities. The entire amount of the purchase price allocated to goodwill will be deductible for income tax purposes pursuant to IRC Section 197 over a 15 year period.
Whole Earth Brands, Inc.
Notes to Consolidated and Combined Financial Statements
The Company’s allocation of purchase price was based upon valuations performed to determine the fair value of the net assets as of the acquisition date and was subject to adjustments for up to one year after the closing date of the acquisition to reflect final valuations. The allocation of purchase price was finalized in the fourth quarter of 2021.
Wholesome Acquisition—On December 17, 2020, the Company entered into a stock purchase agreement (the “Wholesome Purchase Agreement”) with WSO Investments, Inc. (“WSO Investments” and together with its subsidiaries “Wholesome” and affiliates). WSO Investments is the direct parent of its wholly-owned subsidiary Wholesome Sweeteners, Incorporated, which was formed to import, market, distribute, and sell organic sugars, unrefined specialty sugars, and related products. Wholesome is included within the Company’s Branded CPG reportable segment. Wholesome’s results are included in the Company’s consolidated statement of operations from the date of acquisition.
On February 5, 2021, pursuant to the terms of the Wholesome Purchase Agreement, the Company purchased and acquired all of the issued and outstanding shares of capital stock for an initial cash purchase price of $180 million plus up to an additional $55 million (the “Earn-Out Amount”) upon the satisfaction of certain post-closing financial metrics. Subject to the terms and conditions of the Wholesome Purchase Agreement payment of the Earn-Out Amount, in whole or in part, was subject to Wholesome achieving certain EBITDA thresholds at or above approximately $30 million during the period beginning August 29, 2020, and ending December 31, 2021 (the “Earn-Out Period”). A portion of the Earn-Out Amount (up to $27.5 million) could be paid, at the Company’s election, in freely tradeable, registered shares of Company common stock calculated using the 20-day volume weighted average trading price per share as of the date of determination. Calculation of the achievement of the Earn-Out Amount is subject to certain adjustments more thoroughly described in the Wholesome Purchase Agreement. In connection with the acquisition of Wholesome, the Company incurred transaction-related costs of $0.2 million and $4.7 million in the years ended December 31, 2022 and 2021, respectively.
Following the completion of the Earn-Out Period, the Company determined, in accordance with the terms of the Purchase Agreement, that the sellers were entitled to receive the Earn-Out Amount in full. The Company elected to satisfy part of the Earn-Out Amount in common stock and on February 23, 2022, issued 2,659,574 shares of the Company’s common stock. The remaining $30 million portion of the $55 million Earn-Out Amount was paid in cash which was funded from available capacity under the Company’s revolving credit facility. The settlement of the earn-out resulted in a non-cash gain of $1.1 million that was recorded in the first quarter of 2022 which represents the difference in value of the common stock issued using the 20-day volume weighted average trading price per share as compared to the trading price on the date of issuance.
The following summarizes the purchase consideration (in thousands):
| | | | | |
| Base cash consideration | $ | 180,000 | |
| Closing adjustment | 13,863 | |
| Fair value of Earn-Out Amount | 52,395 | |
| Total Purchase Price | $ | 246,258 | |
Whole Earth Brands, Inc.
Notes to Consolidated and Combined Financial Statements
The Company recorded the fair value of the purchase price to tangible and identifiable intangible assets acquired and liabilities assumed as follows (in thousands):
| | | | | |
| Cash and cash equivalents | $ | 2,664 | |
| Accounts receivable | 15,868 | |
| Inventories | 76,879 | |
| Prepaid expenses and other current assets | 1,322 | |
| Property, plant and equipment, net | 3,134 | |
| Operating lease right-of-use assets | 7,585 | |
| Intangible assets | 104,500 | |
| |
| Other assets | 1,189 | |
| Total assets acquired | 213,141 | |
| Accounts payable | 5,251 | |
| Accrued expenses and other current liabilities | 10,576 | |
| Current portion of operating lease liabilities | 1,435 | |
| Operating lease liabilities, less current portion | 6,150 | |
| Deferred tax liabilities, net | 24,234 | |
| |
| Total liabilities assumed | 47,646 | |
| Net assets acquired | 165,495 | |
| Goodwill | 80,763 | |
| Total Purchase Price | $ | 246,258 | |
The values allocated to identifiable intangible assets and their estimated useful lives are as follows:
| | | | | | | | | | | |
| Identifiable intangible assets | Fair Value (in thousands) | | Useful Life (in years) |
| Customer relationships | $ | 55,700 | | | 10 |
| Tradenames | 48,800 | | | 25 |
| $ | 104,500 | | | |
Goodwill represents the excess of the purchase price over the estimated fair value assigned to tangible and identifiable intangible assets acquired and liabilities assumed and represents the future economic benefits expected to arise from other intangible assets acquired that do not qualify for separate recognition, including assembled workforce and expected future market opportunities. Of the purchase price allocated to goodwill, a total of $4.7 million will be deductible for income tax purposes pursuant to IRC Section 197 over a 9-year period.
The Company’s allocation of purchase price was based upon valuations performed to determine the fair value of the net assets as of the acquisition date and is subject to adjustments for up to one year after the closing date of the acquisition to reflect final valuations. The allocation of purchase price was finalized in the first quarter of 2022.
In 2021, the Company recorded measurement period adjustments to its initial allocation of purchase price as a result of ongoing valuation procedures on assets and liabilities assumed, including (i) an increase in purchase price of $3.6 million due to the finalization of the closing adjustment; (ii) a decrease to inventory of $1.8 million; (iii) an increase in prepaid expenses and other current assets of $0.5 million; (iv) an increase in property, plant and equipment of $0.4 million; (v) a decrease to intangible assets of $1.9 million; (vi) a decrease to other assets of $0.1 million; (vii) a decrease to accrued expenses and other current liabilities of $2.7 million; (viii) a decrease to deferred tax liabilities, net of $2.8 million; and (ix) an increase to goodwill of $1.0 million due to the incremental measurement period adjustments discussed in items (i) through (viii). The impact of measurement period adjustments to the results of operations was immaterial.
Whole Earth Brands, Inc.
Notes to Consolidated and Combined Financial Statements
The results of the Company’s operations for the year ended December 31, 2021 includes the results of Wholesome since February 5, 2021. Product revenues, net and operating income of Wholesome included in the Company’s consolidated statement of operations for the year ended December 31, 2021 were $179.6 million and $20.6 million, respectively.
Pro Forma Financial Information—The following unaudited pro forma financial information summarizes the results of operations for the Company as though the Business Combination and Swerve acquisition had occurred on January 1, 2019 and the Wholesome acquisition had occurred on January 1, 2020 (in thousands):
| | | | | | | | | | | |
| Pro Forma Statements of Operations |
| Year Ended |
| December 31, 2021 | | December 31, 2020 |
| Revenue | $ | 514,353 | | | $ | 499,652 | |
| Net income (loss) | $ | 14,082 | | | $ | (38,266) | |
The unaudited pro forma financial information does not assume any impacts from revenue, cost or other operating synergies that could be generated as a result of the acquisitions. The unaudited pro forma financial information is for informational purposes only and is not indicative of the results of operations that would have been achieved had the Business Combination and Swerve acquisitions been consummated on January 1, 2019 and the Wholesome acquisition been consummated on January 1, 2020.
The Successor and Predecessor periods have been combined in the pro forma financial information for the year ended December 31, 2020. The pro forma financial information includes adjustments to reflect intangible asset amortization based on the economic values derived from definite-lived intangible assets, interest expense on the new debt financing, depreciation expense for certain property, plant and equipment that have been adjusted to fair value, and the release of the inventory fair value adjustments into cost of goods sold. These adjustments are net of taxes. The results of the Company’s operations for the year ended December 31, 2022 include Wholesome for the entire period and therefore pro forma financial information is not required.
NOTE 3: LEASES
The Company’s lease portfolio includes factory buildings, office space, warehouses, material handling equipment, vehicles and office equipment. The Company subleases some of its unused office space to third parties. Included in the Wholesome purchase price allocation are right-of-use assets and operating lease liabilities of $7.6 million related to two leases acquired. All leases are classified as operating leases.
Certain leases include one or more options to renew, with renewal terms that can extend the lease term from one to five years or more. The exercise of lease renewal options is at the Company’s sole discretion. For purposes of calculating operating lease liabilities, lease terms include options to extend the lease when it is reasonably certain that the Company will exercise that option.
Lease liabilities and their corresponding right-of-use assets are recorded based on the present value of lease payments over the expected lease term. The interest rate implicit in lease contracts is typically not readily determinable. As such, the Company utilizes the appropriate incremental borrowing rate, which is the rate incurred to borrow on a collateralized basis over a similar term at an amount equal to the lease payments in a similar economic environment.
The Company’s lease agreements do not contain any residual value guarantees. Some leases include variable payments that are based on the usage and occupancy of the leased asset. The Company has elected not to record leases with an initial term of twelve months or less on the balance sheet.
For real estate and vehicle leases, the Company elected the practical expedient to not separate lease from non-lease components within the contract. Electing this practical expedient means the Company accounts for each lease component and the related non-lease component together as a single component. For equipment leases, the Company has not elected this practical expedient and separates the non-lease components from the lease component.
Whole Earth Brands, Inc.
Notes to Consolidated and Combined Financial Statements
The right-of-use asset is subsequently measured throughout the lease term at the carrying amount of the lease liability. Lease expense for lease payments is recognized on a straight-line basis over the lease term.
The components of lease expense were as follows (in thousands):
| | | | | | | | | | | | | | | | | |
| Year Ended December 31, 2022 | | Year Ended December 31, 2021 | | From June 26, 2020 to December 31, 2020 |
| Operating lease expense | $ | 8,370 | | | $ | 5,658 | | | $ | 1,662 | |
| Variable lease expense | 1,634 | | | 1,022 | | | 616 | |
| Short-term lease expense | 711 | | | 988 | | | 47 | |
| Sublease income | (326) | | | (508) | | | (290) | |
| Total | $ | 10,389 | | | $ | 7,160 | | | $ | 2,035 | |
Lease expense under prior lease accounting rules for the period of January 1, 2020 to June 25, 2020 was $2.2 million. Sublease income was $0.3 million from January 1, 2020 through June 25, 2020.
The following table presents the future maturities of the Company’s lease obligations as of December 31, 2022 (in thousands):
| | | | | |
| 2023 | $ | 9,458 | |
| 2024 | 6,834 | |
| 2025 | 3,770 | |
| 2026 | 1,310 | |
| 2027 | 879 | |
| Thereafter | 546 | |
| Total lease payments | 22,797 | |
| Less: imputed interest | (1,329) | |
| Total operating lease liabilities | $ | 21,468 | |
The weighted-average remaining lease term was 3.0 years and the weighted-average discount rate was 4.19% as of December 31, 2022. The weighted-average remaining lease term was 4.0 years and the weighted-average discount rate was 3.99% as of December 31, 2021.
Cash paid for amounts included in the measurement of the lease liability was $8.9 million, $5.7 million and $1.7 million for the years ended December 31, 2022 and 2021 and for the period from June 26, 2020 to December 31, 2020, respectively. Right-of -use assets obtained in exchange for lease liabilities was $0.7 million, $12.9 million and $0.1 million for the years ended December 31, 2022 and 2021 and for the period from June 26, 2020 to December 31, 2020, respectively.
NOTE 4: INVENTORIES
Inventories consisted of the following (in thousands):
| | | | | | | | | | | |
| December 31, 2022 | | December 31, 2021 |
| Raw materials and supplies | $ | 129,131 | | | $ | 129,712 | |
| Work in process | 1,835 | | | 1,480 | |
| Finished goods | 88,009 | | | 81,738 | |
| Total inventories | $ | 218,975 | | | $ | 212,930 | |
Whole Earth Brands, Inc.
Notes to Consolidated and Combined Financial Statements
NOTE 5: PROPERTY, PLANT AND EQUIPMENT
Property, plant and equipment consisted of the following (in thousands):
| | | | | | | | | | | |
| December 31, 2022 | | December 31, 2021 |
| Machinery, equipment and other | $ | 39,695 | | | $ | 32,048 | |
| Buildings and improvements | 21,565 | | | 21,243 | |
| 61,260 | | | 53,291 | |
| Accumulated depreciation | (11,410) | | | (6,591) | |
| 49,850 | | | 46,700 | |
| Land | 5,951 | | | 6,891 | |
| Construction in progress | 2,291 | | | 4,912 | |
| Property, plant and equipment, net | $ | 58,092 | | | $ | 58,503 | |
NOTE 6: GOODWILL AND OTHER INTANGIBLE ASSETS
Goodwill and other intangible assets consisted of the following (in thousands):
| | | | | | | | | | | | | | | | | | | | | | | | | | | | | | | | | | | | | | |
| December 31, 2022 | | | December 31, 2021 |
| Gross | | Accumulated Amortization | | Net | | | Gross | | Accumulated Amortization | | Net |
| Other intangible assets subject to amortization | | | | | | | | | | | | |
Customer relationships (useful life of 5 to 10 years) | $ | 105,298 | | | $ | (26,137) | | | $ | 79,161 | | | | $ | 106,013 | | | $ | (14,478) | | | $ | 91,535 | |
Tradenames (useful life of 25 years) | 171,013 | | | (15,498) | | | 155,515 | | | | 173,522 | | | (8,818) | | | 164,704 | |
| Total | $ | 276,311 | | | $ | (41,635) | | | $ | 234,676 | | | | $ | 279,535 | | | $ | (23,296) | | | $ | 256,239 | |
| Other intangible assets not subject to amortization | | | | | | | | | | | | |
| Product formulations | | | | | 10,700 | | | | | | | | 10,700 | |
| Total other intangible assets, net | | | | | 245,376 | | | | | | | | 266,939 | |
| Goodwill | | | | | 193,139 | | | | | | | | 242,661 | |
| Total goodwill and other intangible assets | | | | | $ | 438,515 | | | | | | | | $ | 509,600 | |
The Company amortizes its intangible assets subject to amortization on a straight-line basis over their respective useful lives. The remaining intangible assets subject to amortization as of December 31, 2022 have a weighted-average remaining useful life of approximately 17.6 years, including weighted-average remaining useful lives of approximately 7.2 years for customer relationships and approximately 22.8 years for tradenames. The Successor’s amortization expense for intangible assets was $18.6 million and $18.3 million for the years ended December 31, 2022 and 2021, respectively, and $6.0 million for the period from June 26, 2020 through December 31, 2020. The Predecessor’s amortization expense for intangible assets was $4.9 million for the period from January 1, 2020 to June 25, 2020.
Whole Earth Brands, Inc.
Notes to Consolidated and Combined Financial Statements
Amortization expense relating to amortizable intangible assets as of December 31, 2022 for the next five years is expected to be as follows (in thousands):
| | | | | |
| 2023 | $ | 18,612 | |
| 2024 | 18,612 | |
| 2025 | 18,373 | |
| 2026 | 18,147 | |
| 2027 | 16,924 | |
The changes in the carrying amounts of goodwill during the years ended December 31, 2022 and December 31, 2021 were as follows (in thousands):
| | | | | | | | | | | | | | | | | |
| Branded CPG | | Flavors & Ingredients | | Total |
| | | | | |
| | | | | |
| | | | | |
| | | | | |
| | | | | |
| | | | | |
| | | | | |
| Balance at December 31, 2020 | $ | 150,323 | | | $ | 3,214 | | | $ | 153,537 | |
| | | | | |
| Purchase accounting adjustments | 2,301 | | | — | | | 2,301 | |
| Acquisition of Wholesome | 80,763 | | | — | | | 80,763 | |
| Currency translation adjustment | 5,470 | | | 590 | | | 6,060 | |
| Balance at December 31, 2021 | $ | 238,857 | | | $ | 3,804 | | | $ | 242,661 | |
| Impairment | (46,500) | | | — | | | (46,500) | |
| Currency translation adjustment | (2,870) | | | (152) | | | (3,022) | |
| Balance at December 31, 2022 | $ | 189,487 | | | $ | 3,652 | | | $ | 193,139 | |
Impairment of Goodwill and Other Indefinite-Lived Intangible Assets—As disclosed in Note 1, the Company reviews goodwill and other indefinite-lived intangible assets for impairment annually, or more frequently if events or changes in circumstances indicate that an asset may be impaired, in accordance with ASC Topic 350.
The Company performs its annual impairment procedures for all of its reporting units and indefinite-lived intangible assets during the fourth quarter of each year. In 2022, the Company performed a quantitative impairment test and estimated the fair values of the reporting units utilizing both the income and market approach to determine the fair values of the Company’s reporting units.
As a result of the 2022 impairment test, the Company determined that the carrying values of the North America and LATAM reporting units within the Branded CPG segment exceeded their respective fair values and as a result, the Company recognized a non-cash impairment charge of $46.5 million in the fourth quarter of 2022, which included $42.5 million related to the North America reporting unit and $4.0 million related to the LATAM reporting unit. The impairment was primarily due to current macroeconomic conditions, including rising interest rates and continued currency devaluation in LATAM, and higher supply chain costs and other inflationary pressures which contributed to lower earnings forecasts for our North America and LATAM reporting units. The income approach incorporated estimated future cash flows and a terminal value discounted to present value using an appropriate risk-adjusted discount rate. The estimated future cash flows reflected management’s best estimate of economic and market conditions over the projected period including forecasted revenue, gross margins, tax rates, capital expenditures, depreciation and amortization, changes in working capital requirements and terminal growth rates. The market approach estimated the fair value of the North America reporting unit using Company specific and guideline company valuation metrics and was equally weighted with the income approach to determine the fair value of the North America reporting unit. The Company used the income approach to determine the fair value of the LATAM reporting unit. After the impairments, the goodwill carrying amount of the North America and LATAM reporting units was approximately $80.5 million and $0 million, respectively.
Whole Earth Brands, Inc.
Notes to Consolidated and Combined Financial Statements
In the fourth quarter of 2021, the Company performed a quantitative impairment test and concluded that their fair values exceeded their respective carrying values and therefore, there was no impairment. In the fourth quarter of 2020, the Company used a qualitative assessment for its impairment tests and concluded that it was more likely than not that their fair values exceeded their respective carrying values and therefore, did not result in an impairment. In the first quarter of 2020, the Predecessor performed an interim impairment assessment at March 31, 2020 as the on-going macroeconomic disruption and uncertainty caused by the COVID-19 pandemic, including the impact on enterprise valuations across sectors, represented events that indicated the carrying value of goodwill and indefinite-lived intangible assets of the Predecessor may not be recoverable. For the interim impairment assessment of indefinite-lived intangible assets, the Predecessor used the income approach to determine fair values. The income approach used the discounted cash flow method which requires assumptions related to projected operating results and a discount rate using a market-based weighted-average cost of capital. The financial projections reflected management’s best estimate of economic and market conditions over the projected period including forecasted revenue growth, gross margins, tax rate, capital expenditures, depreciation and amortization, changes in working capital requirements and the terminal growth rates. It was determined that the carrying value of the indefinite-lived intangible assets at Flavors & Ingredients exceeded their fair value and a non-cash impairment charge of $22.9 million was recorded in the first quarter of 2020. For the interim impairment assessment of goodwill as of March 31, 2020, the Predecessor utilized a market approach to estimate fair value based upon the then proposed purchase price of the Business Combination from a willing buyer in an active open market transaction. As a result of the interim quantitative impairment assessment, the carrying value of the Mafco Worldwide and Merisant reporting units exceeded their fair value by $6.6 million and $11.1 million, respectively, and a non-cash goodwill impairment charge of $17.7 million was recorded in the first quarter of 2020.
NOTE 7: DEBT
Debt consisted of the following (in thousands):
| | | | | | | | | | | |
| December 31, 2022 | | December 31, 2021 |
| Term loan, due 2028 | $ | 368,438 | | | $ | 372,187 | |
| Revolving credit facility, due 2026 | 76,000 | | | 25,000 | |
| Less: current portion | (3,750) | | | (3,750) | |
| Less: unamortized discount and debt issuance costs | (8,516) | | | (9,953) | |
| Total long-term debt | $ | 432,172 | | | $ | 383,484 | |
Maturities—The Company’s debt and other obligations outstanding as of December 31, 2022 mature as shown below (in thousands):
| | | | | |
| 2023 | $ | 3,750 | |
| 2024 | 3,750 | |
| 2025 | 3,750 | |
| 2026 | 79,750 | |
| 2027 | 3,750 | |
| Thereafter | 349,688 | |
| Total debt | 444,438 | |
| Unamortized discounts | (8,516) | |
| Total debt, net of unamortized discounts | $ | 435,922 | |
Loan Agreement—At December 31, 2022, the Company’s senior secured loan agreement consisted of a senior secured term loan facility (the “Term Loan Facility”) of $375 million and a revolving credit facility of up to $125 million (the “Revolving Facility,” and together with the Term Loan Facility, the “Credit Facilities”).
Whole Earth Brands, Inc.
Notes to Consolidated and Combined Financial Statements
As of December 31, 2022 and December 31, 2021, term loan borrowings were $359.9 million and $362.2 million, respectively, net of unamortized discount and debt issuance costs of $8.5 million and $10.0 million, respectively. There were $76.0 million and $25.0 million of borrowings under the revolving credit facility as of December 31, 2022 and December 31, 2021, respectively. Additionally, as of December 31, 2022 and December 31, 2021, the Company’s unamortized debt issuance costs related to the revolving credit facility were $2.0 million and $1.8 million, respectively, which are included in other assets in the consolidated balance sheet. As of both December 31, 2022 and December 31, 2021, there were $2.1 million of outstanding letters of credit that reduced the Company’s availability under the revolving credit facility.
In connection with the closing of the Wholesome Transaction, on February 5, 2021, further discussed in Note 2, the Company and certain of its subsidiaries entered into an amendment and restatement agreement (the “Amended and Restated Agreement”) with Toronto Dominion (Texas) LLC, which amended and restated its existing senior secured loan agreement dated as of June 25, 2020 (as amended on September 4, 2020, the “Existing Credit Agreement,” and as further amended by the Amendment Agreement, the “Amended and Restated Credit Agreement”), by and among Toronto Dominion (Texas), LLC, as administrative agent, certain lenders signatory thereto and certain other parties. As of the date of the Amended and Restated Credit Agreement, the aggregate unamortized debt issuance costs totaled $6.2 million, of which $4.4 million was expensed as a loss on extinguishment of debt in the first quarter of 2021. Additionally, in connection with the Amended and Restated Credit Agreement, the Company paid fees to certain lenders of $3.8 million, which was considered a debt discount, all of which was deferred, and incurred transaction costs of $8.9 million, of which $7.8 million was deferred and $1.1 million was expensed as part of loss on extinguishment and debt transaction costs in the first quarter of 2021.
As further described in Note 2, following the completion of the Wholesome Earn-Out Period, the Company determined, in accordance with the terms of the Purchase Agreement, that the sellers were entitled to receive the Earn-Out Amount in full. The Company elected to satisfy part of the Earn-Out Amount in common stock and on February 23, 2022, issued 2,659,574 shares of the Company’s common stock. The remaining $30 million portion of the $55 million Earn-Out Amount was paid in cash which was funded from available capacity under the Company’s revolving credit facility.
On June 15, 2022, the Company and certain of its subsidiaries entered into a first amendment (the “Amendment”) to the Amended and Restated Agreement dated as of February 5, 2021. The Amendment increased the aggregate principal amount of the Revolving Credit Facility from $75 million to $125 million (the “Amended Revolving Credit Facility”) and transitioned from LIBOR to Secured Overnight Financing Rate (“SOFR”) as the benchmark for purposes of calculating interest for all loans outstanding under the Amended and Restated Credit Agreement. At the election of the Company, loans outstanding under the Amended and Restated Credit Agreement will accrue interest at a rate per annum equal to (i) term SOFR plus 0.10%, 0.15%, or 0.25% in case of, respectively, a one-month, three-month, or six-month interest period (“Adjusted Term SOFR”), or (ii) the greater of the prime rate, the federal funds effective rate plus 0.50%, and one-month Adjusted Term SOFR plus 1.00%, in each case plus the applicable margin which is equal to (i) with respect to the Amended Revolving Credit Facility and letters of credit, (A) 2.75%, in the case of base rate advances, and (B) 3.75% in the case of SOFR advances, and (ii) with respect to the Term Loan Facility, (A) 3.50%, in the case of base rate advances, and (B) 4.50% in the case of SOFR advances. In connection with the Amendment, the Company paid fees and incurred transactions costs of $0.7 million, all of which was deferred.
The transition to SOFR did not materially impact the interest rates applied to the Company’s borrowings. No other material changes were made to the terms of the Company’s Amended and Restated Agreement as a result of the Amendment.
The obligations under the Credit Facilities are guaranteed by certain direct or indirect wholly-owned domestic subsidiaries of the Company, other than certain excluded subsidiaries, including, but not limited to, immaterial subsidiaries and foreign subsidiaries. The Credit Facilities are secured by substantially all of the personal property of the Company and the guarantor subsidiaries (in each case, subject to certain exclusions and qualifications).
The Credit Facilities require the Company to make certain mandatory prepayments, with (i) 100% of net cash proceeds of all non-ordinary course asset sales or other dispositions of property in excess of $5 million in any fiscal year, subject to the ability to reinvest such proceeds and certain other exceptions, (ii) 100% of the net cash proceeds of any debt incurrence, other than debt permitted under the definitive agreements (but excluding debt incurred to refinance the Credit Facilities) and (iii) 50% of “Excess Cash Flow,” as defined in the Amended and Restated Credit Agreement, with a reduction to 25% if the total net leverage ratio for the fiscal year is less than or equal to 3.50 to 1.00 but greater than 3.00 to 1.00, and a reduction to 0% if the total net leverage ratio for the fiscal year is less than or equal to 3.00 to 1.00. The Company also is required to make quarterly amortization payments equal to 0.25% per annum of the original principal amount of the Term Loan Facility (subject to reductions by optional and mandatory prepayments of the loans).
Whole Earth Brands, Inc.
Notes to Consolidated and Combined Financial Statements
NOTE 8: WARRANTS
As of the date of the Business Combination, the Company had approximately 20,263,500 warrants outstanding, consisting of (i) 15,000,000 public warrants originally sold as part of the units issued in Act II’s initial public offering (the “Public Warrants”) and (ii) 5,263,500 Private Warrants that were sold by Act II to the PIPE Investors in conjunction with the Business Combination (collectively with the Public Warrants, the “Warrants”). Each warrant is exercisable for one-half of one share of the Company’s common stock at a price of $11.50 per whole share, subject to adjustment. Warrants may only be exercised for a whole number of shares as no fractional shares will be issued. As of December 31, 2022 and December 31, 2021, the Company had 19,491,320 and 18,929,880 Public Warrants outstanding, respectively, and 771,980 and 1,333,420 Private Warrants outstanding, respectively.
The exercise price and number of ordinary shares issuable upon exercise of the Warrants may be adjusted in certain circumstances including in the event of a share dividend, extraordinary dividend or recapitalization, reorganization, merger or consolidation. If the number of shares of Common Stock purchasable upon the exercise of the Warrants is adjusted, the Warrant price shall be adjusted proportionally. In no event will the Company be required to net cash settle the Warrants. Additionally, the Warrants became exercisable as of July 27, 2020 and expire five years from the date of the Business Combination or earlier upon redemption or liquidation.
There were no Warrants exercised for shares of the Company’s common stock in the year ended December 31, 2022. There were 200 Warrants exercised for 100 shares of the Company’s common stock in the year ended December 31, 2021.
Public Warrants—The Public Warrants are subject to redemption by the Company:
•in whole and not in part;
•at a price of $0.01 per public warrant;
•upon not less than 30 days’ prior written notice of redemption to each warrant holder; and
•if, and only if, the reported last sale price of the ordinary shares for any 20 trading days within a 30-day trading period ending on the third trading day prior to the date on which the Company sends the notice of redemption to the warrant holders equals or exceeds $18 per share (as adjusted).
The Company may not redeem the warrants as described above unless a registration statement under the Securities Act covering the issuance of the ordinary shares issuable upon exercise of the warrants is then effective and a current prospectus relating to those ordinary shares is available throughout the 30-day redemption period. If any such registration statement does not remain effective after closing of the Business Combination, the Company has the right to redeem the warrants on a “cashless” exercise basis. The public warrant holders only have the right to exercise their warrants pursuant to a “cashless” exercise if the Company does not maintain an effective registration statement.
Private Warrants—The Private Warrants are identical to the Public Warrants, except that so long as they are held by the PIPE Investors or any permitted transferees, as applicable, the Private Warrants: (i) may be exercised for cash or on a cashless basis, (ii) were not allowed to be transferred, assigned or sold until thirty (30) days after the closing of the Business Combination, and (iii) shall not be redeemable by the Company. Upon the transfer of a Private Warrant to a party other than a PIPE Investor or a permitted transferee, the Private Warrants become Public Warrants and the fair market value of the Private Warrants at the date of transfer is reclassified to equity. See Note 1 for additional discussion.
NOTE 9: FAIR VALUE MEASUREMENTS
The Company measures and records in its consolidated and combined financial statements certain assets and liabilities at fair value. ASC Topic 820 “Fair Value Measurement and Disclosures,” establishes a fair value hierarchy for instruments measured at fair value that distinguishes between assumptions based on market data (observable inputs) and the Company’s own assumptions (unobservable inputs). This hierarchy consists of the following three levels:
•Level 1 – Assets and liabilities whose values are based on unadjusted quoted prices for identical assets or liabilities in an active market.
•Level 2 – Assets and liabilities whose values are based on inputs other than those included in Level 1, including quoted market prices in markets that are not active; quoted prices of assets or liabilities with similar attributes in active markets; or valuation models whose inputs are observable or unobservable but corroborated by market data.
•Level 3 – Assets and liabilities whose values are based on valuation models or pricing techniques that utilize unobservable inputs that are significant to the overall fair value measurement.
Whole Earth Brands, Inc.
Notes to Consolidated and Combined Financial Statements
Certain assets are measured at fair value on a nonrecurring basis; that is, the instruments are not measured at fair value on an ongoing basis but are subject to fair value adjustments in certain circumstances (for example, when there is evidence of impairment).
Current Assets and Other Financial Assets and Liabilities—Cash and cash equivalents, trade accounts receivable and trade accounts payable are measured at carrying value, which approximates fair value because of the short-term maturities of these instruments.
Contingent Consideration Payable—The Company measured the contingent consideration payable at fair value. The fair value of the contingent consideration utilized Level 3 inputs as it is based on significant inputs not observable in the market as of December 31, 2021, such as projected financial information and discount rate.
Debt—The Company measures its term loan and revolving facilities at original carrying value, net of unamortized deferred financing costs and fees. At December 31, 2022, the estimated fair value of the term loan was $338.0 million as compared to a carrying value of $359.9 million. At December 31, 2021, the estimated fair value of the term loan approximated the carrying value of $362.2 million. The estimated fair value of the outstanding principal balance of the term loan utilized Level 2 inputs as it is based on quoted market prices for identical or similar instruments. The fair value of the revolving facility at both December 31, 2022 and 2021 approximated carrying value.
Warrant Liabilities—The Company classifies its Private Warrants as liabilities in accordance with ASC Topic 815. The Company estimates the fair value of the Private Warrants using a Black-Scholes options pricing model. The fair value of the Private Warrants utilized Level 3 inputs as it is based on significant inputs not observable in the market as of December 31, 2022 and 2021.
The fair value of the Private Warrants was estimated at December 31, 2022 and 2021using a Black-Scholes options pricing model and the following assumptions:
| | | | | | | | | | | | | | |
| Input | | December 31, 2022 | | December 31, 2021 |
| Asset price | | $ | 4.07 | | $ | 10.74 |
| Exercise price | | $ | 11.50 | | $ | 11.50 |
| Risk-free interest rate | | 4.32 | % | | 1.04 | % |
| Expected volatility | | 63.0 | % | | 41.0 | % |
| Expected term (years) | | 2.49 | | 3.49 |
| Dividend yield | | 0.0 | % | | 0.0 | % |
The fair value of warrant liabilities as of December 31, 2022 was $0.2 million. The changes in the warrant liabilities during the years ended December 31, 2022 and 2021 were as follows (in thousands):
| | | | | | | | |
| Reclassification of fair value of Private Warrants to warrant liabilities as of January 1, 2021 | | $ | 8,139 | |
| Cumulative impact of change in fair value of Private Warrants in 2020 | | (1,161) | |
| Transfer of Private Warrants to Public Warrants | | (6,057) | |
| Change in fair value of warrant liabilities in 2021 | | 1,132 | |
| Fair value of warrant liabilities as of December 31, 2021 | | 2,053 | |
| Transfer of Private Warrants to Public Warrants | | (605) | |
| Change in fair value of warrant liabilities in 2022 | | (1,232) | |
| Fair value of warrant liabilities as of December 31, 2022 | | $ | 216 | |
NOTE 10: COMMITMENTS AND CONTINGENCIES
The Company is subject to various claims, pending and possible legal actions for product liability and other damages, and other matters arising out of the conduct of the business. The Company believes, based on current knowledge and consultation with counsel, that the outcome of such claims and actions will not have a material adverse effect on the Company’s consolidated and combined financial position or results of operations.
Whole Earth Brands, Inc.
Notes to Consolidated and Combined Financial Statements
As of December 31, 2022, the Company had obligations to purchase approximately $75.8 million and $1.8 million of raw material during 2023 and 2024, respectively. In addition, the Company had commitments under purchase obligations related to market data research and technology services totaling approximately $4.9 million, of which $3.1 million was short-term and $1.8 million was long-term.
NOTE 11: INCOME TAXES
For the Successor period, the Company’s provision for income taxes consists of U.S., state and local, and foreign taxes. The Company has significant operations in various locations outside the U.S. The annual effective tax rate is a composite rate reflecting the earnings in the various locations at their applicable statutory tax rates.
For the Predecessor period, income taxes as presented herein attribute current and deferred income taxes of the Company’s financial statements in a manner that is systematic, rational, and consistent with the asset and liability method described by ASC 740, “Income Taxes.” Accordingly, the Company’s income tax provision during the predecessor period was prepared following the separate return method. The separate return method applies ASC 740 to the stand-alone financial statements of each member of the combined group as if the group member were a separate taxpayer and a stand-alone enterprise. Use of the separate return method may result in differences when the sum of the amounts allocated to stand-alone tax provisions are compared with amounts presented in the combined financial statements. In that event, the related deferred tax assets and liabilities could be significantly different from those presented herein. The combined financial statements reflect the Company’s portion of income taxes payable as if the Company had been a separate taxpayer.
In August 2022, the Inflation Reduction Act (“IRA”) and CHIPS and Science Act (“CHIPS Act”) were both enacted. This new legislation includes the implementation of a new corporate alternative minimum tax, an excise tax on stock buybacks, and tax incentives for energy and climate initiatives, among other provisions. The income tax provisions of the IRA or the CHIPS Act had limited applicability to the Company and did not have a material impact on the Company’s consolidated and combined financial statements.
On March 27, 2020, the Coronavirus Aid, Relief and Economic Security Act (“CARES Act”) was enacted in response to the COVID-19 pandemic. Under ASC 740, the effects of changes in tax rates and laws are recognized in the period in which the new legislation is enacted. The CARES Act made various tax law changes including among other things (i) increased the limitation under IRC Section 163(j) for 2019 and 2020 to permit additional expensing of interest (ii) enacted a technical correction so that qualified improvement property can be immediately expensed under IRC Section 168(k) (iii) made modifications to the federal net operating loss rules including permitting federal net operating losses incurred in 2018, 2019, and 2020 to be carried back to the five preceding taxable years in order to generate a refund of previously paid income taxes and (iv) enhanced recoverability of alternative minimum tax credit carryforwards. The income tax provisions of the CARES Act had limited applicability to the Company and did not have a material impact on the Company’s consolidated and combined financial statements.
Components of the income tax provision (benefit) were as follows (in thousands):
| | | | | | | | | | | | | | | | | | | | | | | | | | |
| (Successor) | | | (Predecessor) |
| Year Ended December 31, 2022 | | Year Ended December 31, 2021 | | From June 26, 2020 to December 31, 2020 | | | From January 1, 2020 to
June 25, 2020 |
| Current: | | | | | | | | |
| Federal | $ | (364) | | | $ | 916 | | | $ | (969) | | | | $ | 51 | |
| State and local | 419 | | | 283 | | | 54 | | | | 16 | |
| Foreign | 6,190 | | | 3,957 | | | 1,139 | | | | 2,029 | |
| 6,245 | | | 5,156 | | | 224 | | | | 2,096 | |
| Deferred: | | | | | | | | |
| Federal | (2,944) | | | (6,498) | | | (2,192) | | | | (4,262) | |
| State and local | (581) | | | (2,801) | | | 138 | | | | (259) | |
| Foreign | 3,069 | | | (3,001) | | | (788) | | | | (1,057) | |
| (456) | | | (12,300) | | | (2,842) | | | | (5,578) | |
| Total provision (benefit) for income taxes | $ | 5,789 | | | $ | (7,144) | | | $ | (2,618) | | | | $ | (3,482) | |
Whole Earth Brands, Inc.
Notes to Consolidated and Combined Financial Statements
The following is a reconciliation of income tax provision (benefit) computed at the U.S. federal statutory rate to income tax provision (benefit) in the consolidated and combined statements of operations (in thousands):
| | | | | | | | | | | | | | | | | | | | | | | | | | |
| (Successor) | | | (Predecessor) |
| Year Ended December 31, 2022 | | Year Ended December 31, 2021 | | From June 26, 2020 to December 31, 2020 | | | From January 1, 2020 to
June 25, 2020 |
| (Loss) income before income taxes: | | | | | | | | |
| Domestic | $ | (86,952) | | | $ | (36,205) | | | $ | (18,981) | | | | $ | (49,477) | |
| Foreign | 33,989 | | | 29,144 | | | 7,926 | | | | 11,859 | |
| Total (loss) income before income taxes | $ | (52,963) | | | $ | (7,061) | | | $ | (11,055) | | | | $ | (37,618) | |
| | | | | | | | |
| Federal income tax rate | 21.0% | | 21.0% | | 21.0% | | | 21.0% |
| Federal income taxes | $ | (11,122) | | | $ | (1,483) | | | $ | (2,322) | | | | $ | (7,900) | |
| State and local taxes | (1,666) | | | (3,572) | | | 1,812 | | | | (278) | |
| Foreign rate differential | (545) | | | (1,431) | | | (70) | | | | (125) | |
| Change in tax rates | 295 | | | 225 | | | 735 | | | | — | |
| Change in uncertain tax positions | 6 | | | (1,005) | | | 40 | | | | (651) | |
| Change in valuation allowance | 4,588 | | | 2,657 | | | (1,474) | | | | 883 | |
| Goodwill impairment | 9,765 | | | — | | | — | | | | 3,717 | |
| U.S. effects of international operations | 5,603 | | | 3,041 | | | 320 | | | | 2,084 | |
| Tax credits | (3,250) | | | (2,763) | | | (2,161) | | | | (1,201) | |
| Section 162(m) limitation | 87 | | | 206 | | | — | | | | — | |
| Transaction costs | 31 | | | 385 | | | — | | | | — | |
| Stock-based compensation | 422 | | | 502 | | | — | | | | — | |
| Switzerland tax ruling | — | | | (4,057) | | | — | | | | — | |
| Foreign withholding taxes | 1,043 | | | 350 | | | — | | | | — | |
| Other | 532 | | | (199) | | | 502 | | | | (11) | |
| Total provision (benefit) for income taxes | $ | 5,789 | | | $ | (7,144) | | | $ | (2,618) | | | | $ | (3,482) | |
| | | | | | | | |
| Effective tax rate | (10.9)% | | 101.2% | | 23.7% | | | 9.3% |
Whole Earth Brands, Inc.
Notes to Consolidated and Combined Financial Statements
Significant components of the Company’s net deferred tax assets and liabilities were as follows (in thousands):
| | | | | | | | | | | |
| December 31, 2022 | | December 31, 2021 |
| Deferred tax assets: | | | |
| Accounts receivable | $ | 441 | | | $ | 381 | |
| Accrued expenses | 4,938 | | | 5,251 | |
| Inventory | 4,112 | | | 6,166 | |
| Other assets | 1,184 | | | 930 | |
| Pension asset | 2,320 | | | 365 | |
| Capitalized research and development expense | 445 | | | — | |
| Lease accounting | 5,458 | | | 7,558 | |
| U.S. and foreign net operating losses | 19,150 | | | 17,433 | |
| Deferred interest expense | 11,241 | | | 6,106 | |
| Tax credits | 887 | | | 511 | |
| Total deferred tax assets | 50,176 | | | 44,701 | |
| Less valuation allowance | (16,592) | | | (12,184) | |
| Net deferred tax assets | $ | 33,584 | | | $ | 32,517 | |
| Deferred tax liabilities: | | | |
| Property, plant and equipment | (6,270) | | | (5,271) | |
| Operating lease right-of-use asset | (4,621) | | | (6,553) | |
| Intangible assets | (45,964) | | | (46,511) | |
| Deferred rent | (63) | | | (59) | |
| Unremitted earnings | (2,295) | | | (965) | |
| Other liabilities | (6,417) | | | (6,255) | |
| Total deferred tax liabilities | (65,630) | | | (65,614) | |
| Net deferred tax liability | $ | (32,046) | | | $ | (33,097) | |
In assessing the recoverability of its deferred tax assets within the jurisdiction from which they arise, management considers whether it is more likely than not (more than 50%) that some portion or all of the deferred tax assets will be realized. A valuation allowance, if needed, reduces deferred tax assets to the amount expected to be realized. The ultimate realization of deferred tax assets is dependent upon the generation of future taxable income prior to the expiration of any net operating loss and tax credit carry forwards. The Company evaluates all positive and negative evidence when determining the amount of the net deferred tax assets that are more likely than not to be realized. This evidence includes, but is not limited to, prior earnings history, reversal of taxable temporary differences, tax planning strategies and projected future taxable income. Significant weight is given to positive and negative evidence that is objectively verifiable. Based on the weight of available evidence, including the scheduling of existing taxable temporary differences into future taxable income, the Company determined that as of December 31, 2022 its deferred tax assets were realizable on a more-likely-than not basis with the exception of certain interest deductions of $2.3 million, foreign tax credits of $0.8 million, certain state net operating loss carry forwards of $10.2 million predominately related to Illinois, and $3.3 million of net operating loss carry forwards in India, Luxembourg, Spain, Mexico, China and Argentina. The Company’s valuation allowance at December 31, 2022 increased by approximately $4.4 million, of which $4.6 million was charged to income tax expense in 2022 (as shown in the rate reconciliation table above), partially offset by foreign exchange translation adjustments. The Company’s valuation allowance at December 31, 2021 increased by approximately $2.3 million, of which $2.7 million was charged to income tax expense in 2021 (as shown in the rate reconciliation table above), partially offset by foreign exchange translation adjustments.
The Company received a beneficial Switzerland tax ruling in 2021 permitting a step up in the tax basis of intangible assets. The Company will be able to amortize the intangible assets over a 10-year period for Swiss tax purposes, resulting in future cash tax savings. The Company recognized a discrete tax benefit of $4.1 million in 2021 related to this change.
Whole Earth Brands, Inc.
Notes to Consolidated and Combined Financial Statements
As of December 31, 2022, the Company had net operating loss carry forwards and tax credits which will expire if not utilized, including: $123.4 million in Illinois state net operating losses expiring between 2029 and 2042, $0.9 million of U.S. federal foreign tax credits expiring in 2030 through 2032, $47.1 million of federal deferred interest carryforward under IRC Section 163(j) that can be carried forward indefinitely but is limited to 30% tax adjusted EBIT, $1.4 million of net operating losses in Mexico substantially expiring in 2023 and through 2032, $7.9 million of net operating losses in Luxembourg substantially expiring in 2035 and through 2039, $1.8 million of net operating losses in India expiring in 2023 through 2028, $0.6 million of net operating losses in China expiring in 2023 through 2026 and $0.9 million of net operating losses in Argentina expiring in 2026 through 2027.
Notwithstanding the current taxation of certain foreign subsidiaries under GILTI and one-time transition taxation enacted as part of the Tax Cut and Jobs Act, the Company intends to continue to invest these earnings indefinitely outside the U.S. If these future earnings are repatriated to the U.S., or if the Company determines that such earnings will be remitted in the foreseeable future, the Company may be required to accrue U.S. deferred taxes (if any) and applicable withholding taxes. It is not practicable to estimate the tax impact of the reversal of the outside basis difference, or the repatriation of cash due to the complexity of its hypothetical calculation. As of December 31, 2022 and 2021, the Company had accrued future income taxes and withholding taxes for future remittances to its Switzerland and Hong Kong affiliates of $2.3 million and $1.8 million, respectively.
The following summarizes the changes in the Company’s liability for unrecognized tax positions (in thousands):
| | | | | | | | | | | |
| Year Ended December 31, 2022 | | Year Ended December 31, 2021 |
| Beginning of period | $ | 94 | | | $ | 609 | |
| | | |
| | | |
| | | |
| | | |
| Lapse in statute of limitations | — | | | (507) | |
| Currency differences | — | | | (8) | |
| End of period | $ | 94 | | | $ | 94 | |
The unrecognized tax benefits in both the successor and predecessor periods include amounts related to various foreign tax issues. The Company records both accrued interest and penalties related to income tax matters in the provision for income taxes in the accompanying consolidated and combined statements of operations. The Company’s accrued interest and penalties related to uncertain tax positions totaled $0.1 million as of both December 31, 2022 and December 31, 2021. Of the amounts reflected in the table above as of December 31, 2022, the entire amount if recognized, would reduce the Company’s effective tax rate. The Company does not expect its unrecognized tax benefits will significantly increase or decrease in the next 12 months.
The Company is subject to taxation in the U.S. and various state and foreign jurisdictions. The Company’s U.S. federal and state income tax periods are generally open to examination for the tax years 2018 through 2022. The Company’s French, Argentina, Luxembourg and Swiss tax years 2017 through 2022 also remain open for examination. In addition, open tax years related to the Company’s other foreign jurisdictions remain subject to examination but are not considered material.
NOTE 12: PENSION AND OTHER RETIREMENT BENEFITS
Certain current and former employees of the Company are covered under a funded qualified defined benefit retirement plan. Plan provisions covering certain of the Company’s salaried employees generally provide pension benefits based on years of service and compensation. Plan provisions covering certain of the Company’s union members generally provide stated benefits for each year of credited service. The Company’s funding policy is to contribute annually the statutory required amount as actuarially determined. The Company froze the qualified pension plan on December 31, 2019. In addition, the Company has unfunded non-qualified plans covering certain salaried employees with additional retirement benefits in excess of qualified plan limits imposed by federal tax law, which were frozen by the Company on December 31, 2022. The Company uses December 31 as a measurement date for the plans.
Whole Earth Brands, Inc.
Notes to Consolidated and Combined Financial Statements
In February 2021, the Compensation Committee approved the termination of the Company’s qualified defined benefit retirement plan at Flavors & Ingredients. During the fourth quarter of 2021, the Company offered the option of receiving a lump sum payment to certain participants with vested benefits in lieu of receiving monthly annuity payments. Approximately 125 participants elected to receive the settlement, and lump sum payments of approximately $16.8 million were paid from plan assets to these participants in December 2021. The benefit obligation settled approximated payments to plan participants and a pre-tax settlement gain of $0.5 million was recorded in the fourth quarter of 2021. During 2022, the Company purchased non-participating annuity contracts to settle the remaining liabilities of the plan for approximately $9.3 million which was fully funded by plan assets. The annuity contracts purchased along with the plan termination activities resulted in a settlement gain of $1.2 million for the year ended December 31, 2022. The remaining surplus of the plan will be used, as prescribed in the applicable regulations, to fund future contributions to the defined contribution plan at Flavors & Ingredients. At December 31, 2022, the remaining surplus of the plan was approximately $2.5 million.
The following table reconciles the funded status of the Company’s defined benefit pension plans (in thousands):
| | | | | | | | | | | |
| |
| Year Ended December 31, 2022 | | Year Ended December 31, 2021 |
| Accumulated benefit obligations | $ | 7,706 | | | $ | 20,314 | |
| Changes in projected benefit obligations: | | | |
| Projected benefit obligations at beginning of year | $ | 20,314 | | | $ | 41,112 | |
| Service cost | 41 | | | 63 | |
| Interest cost | 326 | | | 1,047 | |
| Actuarial gain | (3,084) | | | (1,054) | |
| Benefits paid | (9,891) | | | (20,854) | |
| | | |
| Projected benefit obligations at end of year | 7,706 | | | 20,314 | |
| Change in plans’ assets: | | | |
| Fair value of plans’ assets at beginning of year | 12,902 | | | 33,058 | |
| Actual returns on plans’ assets | (349) | | | 372 | |
| Employee contributions | 360 | | | 326 | |
| Benefits paid | (9,891) | | | (20,854) | |
| Transfers related to plan termination | (500) | | | — | |
| Fair value of plans’ assets at end of year | 2,522 | | | 12,902 | |
| Net pension liability | $ | (5,184) | | | $ | (7,412) | |
The projected benefit obligation at December 31, 2022 and December 31, 2021 included $7.7 million and $9.8 million, respectively, related to the Company’s unfunded non-qualified plans.
Amounts recognized in the Company’s consolidated and combined balance sheets consisted of (in thousands):
| | | | | | | | | | | |
| Year Ended December 31, 2022 | | Year Ended December 31, 2021 |
| Other assets | $ | 2,522 | | | $ | 2,367 | |
| Accrued expenses and other current liabilities | (355) | | | (488) | |
| Other liabilities | (7,351) | | | (9,291) | |
| Net amount recognized | $ | (5,184) | | | $ | (7,412) | |
Whole Earth Brands, Inc.
Notes to Consolidated and Combined Financial Statements
Amounts recognized in accumulated other comprehensive income (loss), net of tax, which have not yet been recognized as a component of net periodic pension expense for the Company’s defined benefit pension plans, are as follows (in thousands):
| | | | | | | | | | | | | | | | | | | | | | | | | | |
| (Successor) | | | (Predecessor) |
| Year Ended December 31, 2022 | | Year Ended December 31, 2021 | | From June 26, 2020 to December 31, 2020 | | | From January 1, 2020 to
June 25, 2020 |
| Prior service cost | $ | — | | | $ | — | | | $ | — | | | | $ | 169 | |
| Net actuarial (gain) loss | (1,523) | | | (207) | | | (620) | | | | 13,997 | |
| $ | (1,523) | | | $ | (207) | | | $ | (620) | | | | $ | 14,166 | |
As a result of the Business Combination on June 25, 2020, unamortized amounts previously charged to accumulated other comprehensive income (loss) were eliminated.
The components of the changes in unrecognized amounts included in pension obligation, net in other comprehensive income (loss) for the Company’s defined benefit pension plans were as follows (in thousands):
| | | | | | | | | | | | | | | | | | | | | | | | | | |
| (Successor) | | | (Predecessor) |
| Year Ended December 31, 2022 | | Year Ended December 31, 2021 | | From June 26, 2020 to December 31, 2020 | | | From January 1, 2020 to
June 25, 2020 |
| Net actuarial (gain) loss | $ | (1,316) | | | $ | 527 | | | $ | — | | | | $ | 1,912 | |
| Amortization of prior service costs | — | | | — | | | — | | | | (33) | |
| Amortization of actuarial loss | — | | | (36) | | | — | | | | (276) | |
| Total (gain) loss recognized in other comprehensive income (loss) | $ | (1,316) | | | $ | 491 | | | $ | — | | | | $ | 1,603 | |
The components of net periodic benefit (credit) cost for the Company’s defined benefit pension plans for the Successor and Predecessor were as follows (in thousands):
| | | | | | | | | | | | | | | | | | | | | | | | | | |
| (Successor) | | | (Predecessor) |
| Year Ended December 31, 2022 | | Year Ended December 31, 2021 | | From June 26, 2020 to December 31, 2020 | | | From January 1, 2020 to
June 25, 2020 |
| Service cost | $ | 41 | | | $ | 63 | | | $ | 94 | | | | $ | 41 | |
| Interest cost | 326 | | | 1,047 | | | 545 | | | | 593 | |
| Expected return on plan assets | 144 | | | (1,310) | | | (783) | | | | (817) | |
| Amortization of prior service cost | — | | | — | | | — | | | | 33 | |
| Amortization of net actuarial loss | — | | | 36 | | | — | | | | 276 | |
| Settlement income | (1,178) | | | (644) | | | (25) | | | | — | |
| Net periodic benefit (credit) cost | $ | (667) | | | $ | (808) | | | $ | (169) | | | | $ | 126 | |
Whole Earth Brands, Inc.
Notes to Consolidated and Combined Financial Statements
Net periodic benefit (credit) cost is reflected in the Company’s consolidated and combined financial statements as follows for the Successor and Predecessor periods presented (in thousands):
| | | | | | | | | | | | | | | | | | | | | | | | | | |
| (Successor) | | | (Predecessor) |
| Year Ended December 31, 2022 | | Year Ended December 31, 2021 | | From June 26, 2020 to December 31, 2020 | | | From January 1, 2020 to
June 25, 2020 |
| Selling, general and administrative expense | $ | 41 | | | $ | 63 | | | $ | 69 | | | | $ | 41 | |
| Other (income) expense, net | (708) | | | (871) | | | (238) | | | | 85 | |
| Net periodic benefit (credit) cost | $ | (667) | | | $ | (808) | | | $ | (169) | | | | $ | 126 | |
Assumptions—The following assumptions were used to determine the benefit obligation at year end and net periodic benefit (credit) cost during the year for the Company’s funded defined benefit pension plan:
| | | | | | | | | | | |
| Year Ended December 31, 2022 | | Year Ended December 31, 2021 |
| Weighted-average assumptions used to determine benefit obligation at year end: | | | |
| Discount rate (1) | — | % | | 2.38 | % |
| Weighted-average assumptions used to determine net periodic benefit cost: | | | |
| Discount rate | 2.38 | % | | 2.61 | % |
| Expected long-term rate of return on plan assets | 1.70 | % | | 4.90 | % |
(1) The discount rate assumption used to determine the benefit obligation at December 31, 2021 was based on blended 7 year and 15 year duration annuity purchase contracts.
The following assumptions were used to determine the benefit obligation at year end and net periodic benefit (credit) cost during the year for the Company’s unfunded supplemental defined benefit pension plan:
| | | | | | | | | | | |
| Year Ended December 31, 2022 | | Year Ended December 31, 2021 |
| Weighted-average assumptions used to determine benefit obligation at year end: | | | |
| Discount rate | 5.01 | % | | 2.78 | % |
| Rate of compensation increase | — | % | | 3.50 | % |
| Weighted-average assumptions used to determine net periodic benefit cost: | | | |
| Discount rate | 2.78 | % | | 2.42 | % |
| Rate of compensation increase | 3.50 | % | | 3.50 | % |
The Company bases the discount rate assumption on current investment yields of high quality fixed income investments during the retirement benefits maturity period. The rate of increase in future compensation assumptions reflects the Company’s long-term actual experience and future and near-term outlook.
The Company considered a number of factors to determine its expected rates of return on the assets in its plan, including, without limitation, historical performance of the plan assets, investment style, asset allocations and other third-party studies and surveys. The Company considered the plan portfolio’s asset allocation over a variety of time periods and compared them with third-party studies and reviewed performance of the capital markets in recent years and other factors and advice from various third parties, such as the pension plan’s advisors, investment managers and actuaries. While the Company considered recent performance and the historical performance of its plan assets, the Company’s assumptions are based primarily on its estimates of long-term, prospective rates of return. Differences between actual and expected asset returns are recognized in the net periodic benefit cost over the remaining service period of the active participating employees.
Whole Earth Brands, Inc.
Notes to Consolidated and Combined Financial Statements
Plan Assets—The investment committee for the Company’s plan adopted investment policies with the objective of meeting and exceeding over time, the expected long-term rate of return on plan assets assumptions, weighted against a reasonable risk level and considering the appropriate liquidity levels. In connection with this objective, the plan’s assets were mainly invested in mutual funds, common and collective funds, corporate bonds, government bonds, private equity funds, as well as a real estate fund, in order to achieve the Company’s goals to enhance the expected returns of its investments together with their liquidity and protect the plan’s funded status. As a result of the planned termination of the qualified pension plan, certain of the plan’s assets were liquidated during the fourth quarter of 2021 and used to satisfy lump sum benefit payments as further described above, and any remaining plan assets were liquidated during 2022. Therefore, at December 31, 2022 the plan’s assets were invested in cash and cash equivalents and at December 31, 2021, the plan’s assets were primarily invested in cash and fixed income securities.
The following tables set forth, by category, the Company’s pension plan assets as of December 31, 2022 and December 31, 2021, using the fair value hierarchy established under ASC Topic 820 and as described in Note 9. The fair value hierarchy in the table as of December 31, 2021 excludes certain investments which are valued using Net Asset Value (“NAV”) as a practical expedient (in thousands):
| | | | | | | | | | | | | | | | | | | | | | | |
| Pension Plan Assets as of December 31, 2022 |
| Level 1 | | Level 2 | | Level 3 | | Total |
| Pension plan assets measured at fair value: | | | | | | | |
| Cash and cash equivalents | $ | 2,522 | | | $ | — | | | $ | — | | | $ | 2,522 | |
| Total pension plan assets measured at fair value | $ | 2,522 | | | $ | — | | | $ | — | | | $ | 2,522 | |
| | | | | | | | | | | | | | | | | | | | | | | |
| Pension Plan Assets as of December 31, 2021 |
| Level 1 | | Level 2 | | Level 3 | | Total |
| Pension plan assets measured at fair value: | | | | | | | |
| Cash and cash equivalents | $ | 325 | | | $ | — | | | $ | — | | | $ | 325 | |
| U.S. Government securities | — | | | 6,283 | | | — | | | 6,283 | |
| Corporate bonds | — | | | 6,283 | | | — | | | 6,283 | |
| Total pension plan assets measured at fair value | $ | 325 | | | $ | 12,566 | | | $ | — | | | $ | 12,891 | |
| | | | | | | |
| Pension plan assets measured at NAV as a practical expedient (1) | | | | | | | 11 | |
| Total pension plan assets | | | | | | | $ | 12,902 | |
(1) Certain investments in real estate funds that are measured at fair value using the NAV per share practical expedient have not been categorized in the fair value hierarchy. The fair value amounts presented in the table above are intended to permit reconciliation of the fair value hierarchy to the total value of plan assets.
Cash and cash equivalents are stated at cost, which approximates fair market value. Corporate and government bonds are generally valued on the basis of evaluated bids furnished by a pricing service, which determines valuations for normal, institutional size-trading units of such securities using market information, transactions for comparable securities and various relationships between securities. There were no transfers between levels within the three-tier fair value hierarchy in 2022 and 2021.
Contributions—The Company does not expect to make further contributions to its funded defined benefit pension plan due to its termination.
Whole Earth Brands, Inc.
Notes to Consolidated and Combined Financial Statements
Expected Future Benefit Payments—The projected benefit payments for the unfunded non-qualified defined benefit pension plans are as follows (in thousands):
| | | | | |
| |
| 2023 | $ | 355 | |
| 2024 | 357 | |
| 2025 | 426 | |
| 2026 | 587 | |
| 2027 | 584 | |
| 2028-2032 | 3,125 | |
The Company also participates in certain state-sponsored defined benefit plans covering certain non-U.S. employees with total net liabilities of $1.9 million and $3.6 million as of December 31, 2022 and December 31, 2021, respectively. The primary state-sponsored plan relates to Merisant employees in Switzerland and France, which had pension benefit obligations of $5.5 million and plan assets of $3.6 million as of December 31, 2022 and a pension benefit obligation of $6.9 million and plan assets of $3.4 million as of December 31, 2021. Net periodic pension cost for 2022, 2021, for the period June 26, 2020 through December 31, 2020, and January 1, 2020 through June 25, 2020 was $0.4 million, $0.4 million, $0.2 million, and $0.3 million, respectively.
Defined Contribution Pension Plans—The Company has defined contribution 401(k) plans covering certain eligible domestic employees, as defined by the plans. The plans provide for certain employer matching contributions. The Company recorded compensation expense related to its defined contribution plans of $1.2 million for 2022, $1.0 million for 2021, $0.2 million for the period from June 26, 2020 to December 31, 2020, and $0.3 million for the period from January 1, 2020 to June 25 2020.
NOTE 13: STOCK-BASED COMPENSATION
On June 24, 2020, the Whole Earth Brands, Inc. 2020 Long-Term Incentive Plan (the “Plan”) was approved for the purpose of promoting the long-term financial interests and growth of the Company and its subsidiaries by attracting and retaining management and other personnel and key service providers. The Plan provides for the granting of stock options (“SOs”), stock appreciation rights (“SARs”), restricted stock awards (“RSAs”), restricted stock units (“RSUs”), performance shares, performance share units (“PSUs”) and other stock-based awards to officers, employees and non-employee directors of, and certain other service providers to, the Company and its subsidiaries. These awards are settled in shares of the Company’s stock and therefore classified as equity awards. Under the terms of the Plan, an aggregate of 9,300,000 shares of common stock are authorized for issuance under the Plan.
The RSUs and RSAs are accounted for as equity awards and have a grant-date fair value equal to the fair market value of the underlying stock on the grant date. RSUs granted generally vest ratably on the anniversary of the grant date over a period of one to three years, depending on the specific terms of each RSU agreement. The RSAs granted to non-employee board members cliff vest over a service period of approximately 24 months. The Company records compensation expense over the expected vesting period and recognizes forfeitures in the period incurred.
PSU awards generally cliff vest subsequent to the completion of the cumulative three-year performance period, depending on the period specified in each respective PSU agreement. The number of PSUs that ultimately vest depends on the Company’s performance relative to a specified cumulative financial targets established for each grant and are expected to be settled in stock.
Stock-based compensation expense for the year ended December 31, 2022 and 2021, and for the period from June 26, 2020 to December 31, 2020 was $4.9 million, $8.7 million, and $1.3 million respectively. Stock-based compensation expense for the year ended December 31, 2021 included $0.9 million of expense related to 2021 management bonuses that were settled in stock during the second quarter of 2022. The tax benefit recognized related to stock-based compensation was $0.4 million and $0.5 million for the years ended December 31, 2022 and 2021. There was no tax benefit recognized related to stock-based compensation for the period from June 26, 2020 to December 31, 2020.
Whole Earth Brands, Inc.
Notes to Consolidated and Combined Financial Statements
A summary of activity and weighted average fair values related to the RSUs is as follows:
| | | | | | | | | | | | | | | | | |
| Shares | | Weighted Average Grant Date
Fair Value (per share) | | Weighted Average
Remaining
Contractual Term
(in years) |
| Outstanding at December 31, 2021 | 484,744 | | | $ | 13.46 | | | 1.02 |
| Granted | 1,742,191 | | | 5.42 | | | |
| Vested | (217,734) | | | 12.96 | | | |
| Forfeited | (470,442) | | | 4.58 | | | |
| Outstanding and nonvested at December 31, 2022 | 1,538,759 | | | $ | 6.65 | | | 0.71 |
The weighted average grant date fair value per share of RSUs granted during the year was $5.42 in 2022, $13.48 in 2021, and $8.34 for the period from June 26, 2020 through December 31, 2020.
The aggregate fair value of RSUs upon vesting during the years ended December 31, 2022 and 2021 was $1.5 million and $7.2 million, respectively. No RSUs vested during the period from June 26, 2020 to December 31, 2020.
A summary of activity and weighted average fair values related to the RSAs is as follows:
| | | | | | | | | | | | | | | | | |
| Shares | | Weighted Average Grant Date
Fair Value (per share) | | Weighted Average
Remaining
Contractual Term
(in years) |
| Outstanding at December 31, 2021 | 117,801 | | | $ | 9.76 | | | 0.98 |
| Granted | 82,615 | | | 6.96 | | | |
| Vested | (68,946) | | | 8.34 | | | |
| Outstanding and nonvested at December 31, 2022 | 131,470 | | | $ | 8.75 | | | 1.19 |
The weighted average grant date fair value per share of RSAs granted during the year was $6.96 in 2022, $11.77 in 2021, and $8.34 for the period from June 26, 2020 through December 31, 2020.
The aggregate fair value of RSAs upon vesting during the year ended December 31, 2022 was $0.5 million. No RSAs vested during the year ended 2021 or the period from June 26, 2020 to December 31, 2020.
A summary of activity and weighted average fair values related to the PSUs is as follows:
| | | | | | | | | | | | | | | | | |
| Shares | | Weighted Average Grant Date
Fair Value (per share) | | Weighted Average
Remaining
Contractual Term
(in years) |
| Outstanding at December 31, 2021 | 282,141 | | | $ | 13.65 | | | 2.21 |
| Granted | 572,845 | | | 7.19 | | | |
| Forfeited | (223,609) | | | 6.04 | | | |
| Outstanding and nonvested at December 31, 2022 | 631,377 | | | $ | 8.49 | | | 1.88 |
Whole Earth Brands, Inc.
Notes to Consolidated and Combined Financial Statements
The weighted average grant date fair value per share of PSUs granted during the year was $7.19 in 2022 and $13.65 in 2021.
As of December 31, 2022, the Company had not yet recognized compensation cost on nonvested awards as follows (in thousands):
| | | | | | | | | | | |
| Unrecognized
Compensation Cost | | Weighted Avg.
Remaining
Recognition Period
(in years) |
| Nonvested awards | $ | 6,507 | | | 1.06 years |
The nonvested awards excludes unvested PSUs that are deemed not probable of vesting constituting $5.4 million of unrecognized compensation expense at December 31, 2022.
NOTE 14: STOCKHOLDERS' EQUITY
Common Stock Repurchase Plan—On September 8, 2020, the Company announced that its board of directors had authorized a stock repurchase plan of up to $20 million of shares of the Company’s common stock. The shares were available for repurchase from time to time over a 12-month period which expired on September 15, 2021, in open market transactions at prevailing market prices, in privately negotiated transactions, or by other means in accordance with U.S. federal securities laws. There were no repurchases of the Company’s common stock under the stock repurchase plan.
NOTE 15: EARNINGS PER SHARE
Basic earnings (loss) per common share (“EPS”) is calculated by dividing net income (loss) by the weighted average number of common shares outstanding for the period. Warrants issued are not considered outstanding at the date of issuance. RSUs and RSAs also are not considered outstanding until they have vested. Contingently issuable shares associated with outstanding PSUs that have cliff vesting based on achievement of a performance condition were not included in the earnings per share calculations for the periods presented as the applicable vesting conditions had not been satisfied.
Diluted EPS is calculated by dividing net income (loss) by the weighted average shares outstanding assuming dilution. Dilutive common shares outstanding is computed using the treasury stock method and reflects the additional shares that would be outstanding if dilutive warrants were exercised and restricted stock units and restricted stock awards were settled for common shares during the period.
For warrants that are liability-classified, during the periods when the impact would be dilutive, the Company assumes share settlement of the instruments as of the beginning of the reporting period and adjusts the numerator to remove the change in the fair value of warrant liability and adjusts the denominator to include the dilutive shares using the treasury stock method.
Whole Earth Brands, Inc.
Notes to Consolidated and Combined Financial Statements
The computation of basic and diluted EPS for the years ended December 31, 2022 and 2021 and the period from June 26, 2020 to December 31, 2020 is shown below (in thousands, except for share and per share data):
| | | | | | | | | | | | | | | | | |
| Year Ended December 31, 2022 | | Year Ended December 31, 2021 | | From June 26, 2020 to December 31, 2020 |
| EPS numerator: | | | | | |
| Net (loss) income attributable to common shareholders | $ | (58,752) | | | $ | 83 | | | $ | (8,437) | |
| Less: Change in fair value of warrant liabilities | — | | | (29) | | | — | |
| Numerator - diluted | $ | (58,752) | | | $ | 54 | | | $ | (8,437) | |
| | | | | |
| EPS denominator: | | | | | |
| Weighted average shares outstanding - basic | 41,481,079 | | | 38,505,458 | | | 38,426,669 | |
| Effect of dilutive securities | — | | | 1,370,929 | | | — | |
| Weighted average shares outstanding - diluted | 41,481,079 | | | 39,876,387 | | | 38,426,669 | |
| | | | | |
| Net earnings (loss) per share: | | | | | |
| Basic | $ | (1.42) | | | $ | 0.00 | | | $ | (0.22) | |
| Diluted | $ | (1.42) | | | $ | 0.00 | | | $ | (0.22) | |
For the year ended December 31, 2022, 20,263,300 warrants, 1,538,759 RSUs, and 131,470 RSAs were excluded from the diluted EPS calculation because they were determined to be anti-dilutive. For the period from June 26, 2020 to December 31, 2020, 20,263,500 warrants, 633,057 RSUs, and 68,946 RSAs were excluded from the diluted EPS calculation because they were determined to be anti-dilutive. Additionally, at December 31, 2022 and 2021, 631,377 and 282,141 PSUs, respectively, were excluded from the diluted EPS calculation because they are subject to performance conditions that were not satisfied.
NOTE 16: ACCUMULATED OTHER COMPREHENSIVE INCOME (LOSS)
The following table summarizes accumulated other comprehensive income (loss) (“AOCI”), net of taxes, by component (in thousands):
| | | | | | | | | | | | | | | | | |
| Net Currency
Translation
Gains
(Losses) | | Funded Status of Benefit Plans | | Total
Accumulated
Other Comprehensive
Income (Loss) |
| Balance at December 31, 2020 | $ | 7,774 | | | $ | 831 | | | $ | 8,605 | |
| Other comprehensive income before reclassifications | 984 | | | 701 | | | 1,685 | |
| Amounts reclassified from AOCI | — | | | (603) | | | (603) | |
| Balance at December 31, 2021 | $ | 8,758 | | | $ | 929 | | | $ | 9,687 | |
| Other comprehensive (loss) income, before reclassifications | (13,469) | | | 2,926 | | | (10,543) | |
| Amounts reclassified from AOCI | — | | | (186) | | | (186) | |
| Balance at December 31, 2022 | $ | (4,711) | | | $ | 3,669 | | | $ | (1,042) | |
Whole Earth Brands, Inc.
Notes to Consolidated and Combined Financial Statements
NOTE 17: RELATED PARTY TRANSACTIONS
The Predecessor participated in MacAndrews & Forbes’ (“MacAndrews”) directors and officer’s insurance program, which covered the Predecessor along with MacAndrews and its other affiliates. The limits of coverage were available on aggregate losses to any or all of the participating companies and their respective directors and officers. For the period of January 1, 2020 to June 25, 2020, the Predecessor reimbursed MacAndrews an immaterial amount for its allocable portion of the premiums for such coverage, which the Predecessor believed was more favorable than the premiums that it could have secured were it to secure its own coverage. The Predecessor also participated in certain other insurance programs with MacAndrews under which it paid premiums directly to the insurance broker.
In March 2018, the Predecessor entered into a revolving credit agreement with Wesco US LLC, an indirect and wholly-owned subsidiary of Merisant. This revolving credit facility, as amended, had a maturity date of January 3, 2022 and provided for maximum outstanding borrowings of up to $9.0 million. The revolving credit facility was unsecured and bore interest at 3-month LIBOR plus 4.0% and provided for periodic interest payments with all principal due upon maturity. MacAndrews had the right to accept or reject any borrowing request made by the Predecessor pursuant to the revolving credit agreement in its sole discretion. The outstanding balance on the revolving credit agreement at June 25, 2020 was $3.4 million and was forgiven by MacAndrews in connection with the Business Combination. Interest expense for the period from January 1, 2020 to June 25, 2020 was approximately $0.2 million.
In July 2020, the Company entered into an agreement with Watermill Institutional Trading LLC, a registered broker-dealer (“Watermill”), to act as one of the Company’s financial advisors for a 12-month period commencing July 22, 2020 for total consideration of $0.9 million, of which $0.5 million and $0.4 million was expensed during the year ended December 31, 2021 and the period from June 26, 2020 to December 31, 2020, respectively. Additionally, under the terms of the agreement, the Company incurred additional expense of $2.0 million during the year ended December 31, 2021 related to services provided by Watermill in connection with the acquisition of Wholesome and $0.8 million during the period from June 26, 2020 to December 31, 2020 related to services provided in connection with the acquisition of Swerve. A former director of Act II is a registered representative of Watermill and provided services directly to the Company under the agreement.
In December 2019, Wholesome entered into a partnership agreement to form WS Services, LLC (“WS Services”). As of December 31, 2022, Wholesome had a 50% interest in the partnership and accounts for the partnership as an equity method investment. Wholesome’s investment in the partnership, which is classified as other assets in the consolidated balance sheets, was $0.7 million as of both December 31, 2022 and 2021. Wholesome utilizes a warehouse leased by WS Services for storage of raw materials. During both the year ended December 31, 2022 and the period from February 5, 2021 through December 31, 2021, Wholesome expensed $0.9 million related to the use of the warehouse space. Wholesome recorded a payable to WS Services for $0.1 million and $0.3 million as of December 31, 2022 and 2021.
NOTE 18: BUSINESS SEGMENTS
The Company has two reportable segments: Branded CPG and Flavors & Ingredients. In addition, the Company’s corporate office functions are reported and included under Corporate. Corporate is not a reportable or operating segment but is included for reconciliation purposes and includes the costs for the corporate office administrative activities as well as transaction-related and other costs. Certain prior year amounts have been reclassified to conform to the current presentation. The Company does not present assets by reportable segments as they are not reviewed by the Chief Operating Decision Maker for purposes of assessing segment performance and allocating resources.
Whole Earth Brands, Inc.
Notes to Consolidated and Combined Financial Statements
The following table presents selected financial information relating to the Company’s business segments (in thousands):
| | | | | | | | | | | | | | | | | | | | | | | | | | |
| (Successor) | | | (Predecessor) |
| Year Ended December 31, 2022 | | Year Ended December 31, 2021 | | From June 26, 2020 to December 31, 2020 | | | From January 1, 2020 to
June 25, 2020 |
| Product revenues, net | | | | | | | | |
| Branded CPG | $ | 422,638 | | | $ | 389,174 | | | $ | 96,857 | | | | $ | 80,749 | |
| Flavors & Ingredients | 115,634 | | | 104,799 | | | 50,311 | | | | 47,579 | |
| Total product revenues, net | $ | 538,272 | | | $ | 493,973 | | | $ | 147,168 | | | | $ | 128,328 | |
| | | | | | | | |
| Operating (loss) income | | | | | | | | |
| Branded CPG | $ | (30,182) | | | $ | 34,918 | | | $ | 13,463 | | | | $ | (5,055) | |
| Flavors & Ingredients | 32,505 | | | 21,860 | | | (2,645) | | | | (23,718) | |
| 2,323 | | | 56,778 | | | 10,818 | | | | (28,773) | |
| Corporate | (26,969) | | | (33,962) | | | (16,924) | | | | (9,408) | |
| Total operating (loss) income | $ | (24,646) | | | $ | 22,816 | | | $ | (6,106) | | | | $ | (38,181) | |
The following table presents geographic information based upon revenues of the Company’s major geographic markets (in thousands):
| | | | | | | | | | | | | | | | | | | | | | | | | | |
| (Successor) | | | (Predecessor) |
| Year Ended December 31, 2022 | | Year Ended December 31, 2021 | | From June 26, 2020 to December 31, 2020 | | | From January 1, 2020 to
June 25, 2020 |
| North America | $ | 357,175 | | | $ | 318,958 | | | $ | 63,386 | | | | $ | 54,253 | |
| Europe | 92,272 | | | 96,013 | | | 45,608 | | | | 42,776 | |
| India, Middle East and Africa | 19,940 | | | 14,801 | | | 6,996 | | | | 3,959 | |
| Asia-Pacific | 53,300 | | | 51,598 | | | 24,350 | | | | 20,834 | |
| Latin America | 15,585 | | | 12,603 | | | 6,828 | | | | 6,506 | |
| Total product revenues, net | $ | 538,272 | | | $ | 493,973 | | | $ | 147,168 | | | | $ | 128,328 | |
The Company has a large and diverse customer base, which includes numerous customers located in foreign countries. Branded CPG’s combined sales to a single customer accounted for 14.1% and 10.6% of total sales in 2022 and 2021, respectively. No single customer accounted for more than 10% of total sales in 2020. With the exception of the United States, no one country represented more than 10% of the Company’s net sales.
The Company has an exclusive supply contract to purchase the output of licorice extract and certain licorice derivatives from a manufacturer with facilities in Central Asia. For the year ended December 31, 2022, the Company’s purchases from this supplier totaled approximately $9.1 million, representing 23.4% of the Company’s licorice raw material purchases for the year.
Whole Earth Brands, Inc.
Notes to Consolidated and Combined Financial Statements
Long-lived assets are as follows (in thousands): | | | | | | | | | | | |
| December 31, 2022 | | December 31, 2021 |
| Long-Lived Assets* | | | |
| United States | $ | 24,516 | | | $ | 24,327 | |
| China | 14,805 | | | 15,620 | |
| Czech Republic | 6,451 | | | 6,074 | |
| France | 10,960 | | | 11,353 | |
| Other Foreign Countries | 1,360 | | | 1,129 | |
| Total | $ | 58,092 | | | $ | 58,503 | |
*Long-lived assets consist of property, plant and equipment, net.
Item 9. Changes in and Disagreements with Accountants on Accounting and Financial Disclosure.
None.
Item 9A. Controls and Procedures.
Controls and Procedures
Disclosure controls and procedures are controls and other procedures that are designed to ensure that information required to be disclosed in our reports filed or submitted under the Exchange Act, is recorded, processed, summarized and reported within the time periods specified in the SEC’s rules and forms. Disclosure controls and procedures include, without limitation, controls and procedures designed to ensure that information required to be disclosed in our reports filed or submitted under the Exchange Act is accumulated and communicated to our management, including our principal executive officer and principal financial officer, to allow timely decisions regarding required disclosure.
Evaluation of Disclosure Controls and Procedures
As of the end of the period covered by this Annual Report on Form 10-K, we conducted an evaluation, under the supervision and with the participation of our management, including our principal executive officer and principal financial officer, of our disclosure controls and procedures (as defined in Rules 13a-15(e) and 15d-15(e) under the Exchange Act). The Company’s management and the principal executive officer and principal financial officer concluded that, as of December 31, 2022, our disclosure controls and procedures were effective to ensure that the information required to be disclosed by us in reports that we file or submit under the Exchange Act is recorded, processed, summarized and reported within the time periods specified in the SEC’s rules and forms.
Changes in Internal Control over Financial Reporting
There have been no changes in internal control over financial reporting that occurred during the year ended December 31, 2022 that have materially affected, or are reasonably likely to materially affect, our internal control over financial reporting.
Management’s Report on Internal Controls over Financial Reporting
Management is responsible for designing, implementing and maintaining adequate internal control over financial reporting, as such term is defined in Rules 13a-15(f) or 15d-15(f) under the Exchange Act. Internal control over financial reporting, no matter how well designed, has inherent limitations. Therefore, even those systems determined to be effective can provide only reasonable assurance with respect to financial statement preparation and presentation. Further, because of changes in conditions, the effectiveness of internal control over financial reporting may vary over time.
Our management, with the participation of our principal executive officer and principal financial officer, assessed the effectiveness of the Company’s internal control over financial reporting as of December 31, 2022. Management’s assessment was based on criteria set forth by the Committee of Sponsoring Organizations of the Treadway Commission (“COSO”) in Internal Control - Integrated Framework (2013). Based upon this assessment, management concluded that the Company’s internal control over financial reporting was effective as of December 31, 2022.
As discussed in this Annual Report on Form 10-K, this Annual Report on Form 10-K does not include an attestation report of our independent registered public accounting firm pursuant to an exemption made available to us as an emerging growth company.
Item 9B. Other Information.
None.
Item 9C. Disclosures Regarding Foreign Jurisdictions That Prevent Inspections.
None.
PART III
Item 10. Directors, Executive Officers and Corporate Governance.
We will provide information that is responsive to this Item 10 in our definitive proxy statement or in an amendment to this Annual Report on Form 10-K not later than 120 days after December 31, 2022. Such information is incorporated into this Item 10 by reference.
Item 11. Executive Compensation.
We will provide information that is responsive to this Item 11 in our definitive proxy statement or in an amendment to this Annual Report on Form 10-K not later than 120 days after December 31, 2022. Such information is incorporated into this Item 11 by reference.
Item 12. Security Ownership of Certain Beneficial Owners and Management and Related Stockholder Matters.
The number of shares to be issued upon exercise or vesting of awards issued under, and the number of shares remaining for future issuance under our equity compensation plans at December 31, 2022 were as follows:
| | | | | | | | | | | | | | | | | |
| Number of securities to be issued upon exercise of outstanding options, warrants and rights(1) | | Weighted average exercise price per share of outstanding options, warrants and rights(2) | | Number of securities remaining available for future issuance under equity compensation plans (excluding securities reflected in column (a))(3) |
| Plan Category | (a) | | (b) | | (c) |
| Equity compensation plans approved by security holders | 2,301,606 | | | $ | — | | | 5,805,675 | |
| Equity compensation plans not approved by security holders | — | | | $ | — | | | — | |
| Total | 2,301,606 | | | | | 5,805,675 | |
(1) Includes 131,470 RSAs, 1,538,759 RSUs and 631,377 PSUs outstanding under our LTIP plans.
(2) There are no amounts provided under this column because only RSAs, RSUs and PSUs have been granted.
(3) Awards issuable under our LTIP plans include stock options, stock appreciation rights, stock awards, stock units, performance units and other stock-based awards.
Information related to the security ownership of certain beneficial owners and management will be provided in our 2023 proxy statement or in an amendment to this Annual Report on Form 10-K not later than 120 days after December 31, 2022. Such information is incorporated into this Item 12 by reference.
Item 13. Certain Relationships and Related Transactions, and Director Independence.
We will provide information that is responsive to this Item 13 in our definitive proxy statement or in an amendment to this Annual Report on Form 10-K not later than 120 days after December 31, 2022. Such information is incorporated into this Item 13 by reference.
Item 14. Principal Accounting Fees and Services.
We will provide information that is responsive to this Item 14 in our definitive proxy statement or in an amendment to this Annual Report on Form 10-K not later than 120 days after December 31, 2022. Such information is incorporated into this Item 14 by reference.
PART IV
Item 15. Exhibits, Financial Statement Schedules.
a)The following documents are filed as part of this report:
(1)Financial Statements
All financial statements of the Company as set forth under Item 8 of this Annual Report on Form 10-K.
(2)Financial Statement Schedules
All schedules are omitted because they are either not applicable or the required information is disclosed in our audited consolidated and combined financial statements or the accompanying notes.
(3)Exhibits
The following exhibits are either attached or incorporated herein by reference to another filing with the U.S. Securities and Exchange Commission.
| | | | | | | | |
| Exhibit No. | | Description |
| 2.1† | | |
| 2.2† | | |
| 2.3† | | |
| 2.4† | | |
| 2.5#† | | Equity Purchase Agreement, dated as of November 10, 2020, by and among Whole Earth Brands, Inc., RF Development, LLC, Swerve, L.L.C., and Swerve IP, L.L.C. (incorporated by reference to Exhibit 2.1 of the Company’s Current Report on Form 8-K, filed with the SEC on November 12, 2020). |
| 2.6#† | | Stock Purchase Agreement dated as of December 17, 2020, by and among Whole Earth Brands, Inc., WSO Investments, Inc., WSO Holdings, LP, Edwards Billington and Son, Limited and WSO Holdings, LLC (incorporated by reference to Exhibit 2.1 of the Company’s Current Report on Form 8-K, filed with the SEC on December 17, 2020). |
| 3.1 | | |
| 3.2 | | |
| 3.3 | | |
| 3.4 | | |
| 4.1 | | |
| | | | | | | | |
| 4.2 | | |
| 4.3 | | |
| 10.1#‡ | | |
| 10.2 | | |
| 10.3 | | |
| 10.4 | | |
| 10.5 | | |
| 10.6+ | | |
| 10.7+ | | |
10.8+
| | |
| 10.9+ | | |
10.10+
| | |
| 10.11+ | | |
| 10.12+ | | |
| 10.13+ | | |
| 10.14+ | | |
| 10.15*+ | | |
| 10.16 | | |
| 10.17 | | |
| | | | | | | | |
| 10.18+ | | |
| 10.19+ | | |
| 10.20+ | | |
| 10.21+ | | |
| 10.22+ | | |
| 21.1* | | |
| 23.1* | | |
| 31.1* | | |
| 31.2* | | |
| 32.1* | | |
| 32.2* | | |
| 101.INS* | | XBRL Instance Document the instance document does not appear in the Interactive Data File because its XBRL tags are embedded within the Inline XBRL Document |
| 101.SCH* | | XBRL Taxonomy Extension Schema Document |
| 101.CAL * | | XBRL Taxonomy Extension Calculation Linkbase Document |
| 101.LAB* | | XBRL Taxonomy Extension Labels Linkbase Document |
| 101.PRE* | | XBRL Taxonomy Extension Presentation Linkbase Document |
| 101.DEF* | | XBRL Taxonomy Extension Definition Linkbase Document |
| 104* | | The cover page for the Company’s Annual Report on Form 10-K has been formatted in Inline XBRL and contained in Exhibit 101 |
| | | | | |
| * | Filed herewith. |
| |
| + | Indicates a management or compensatory plan |
† | Schedules to this exhibit have been omitted pursuant to Item 601(b)(2) of Registration S-K. The registrant hereby agrees to furnish a copy of any omitted schedules to the SEC upon request. |
| # | Certain schedules and exhibits to this agreement have been omitted pursuant to Item 601(a)(5) of Regulation S-K. A copy of any omitted schedule and/or exhibit will be furnished supplementally to the SEC upon request. |
‡ | Certain portions of this exhibit (indicated by “[***]”) have been omitted pursuant to Regulation S-K, Item 601(b)(10). |
Item 16. Form 10-K Summary.
Not applicable.
SIGNATURES
Pursuant to the requirements of Section 13 or 15(d) of the Securities Exchange Act of 1934, the registrant has duly caused this report to be signed on its behalf by the undersigned, thereunto duly authorized on March 13, 2023.
| | | | | |
WHOLE EARTH BRANDS, INC. |
| By: | /s/ Michael Franklin |
| Name: | Michael Franklin |
| Title: | Interim Chief Executive Officer |
| (Principal Executive Officer) |
Pursuant to the requirements of the Securities Exchange Act of 1934, this report has been signed below by the following persons on behalf of the registrant and in the capacities and on the dates indicated.
| | | | | | | | | | | |
| Name | | Position | Date |
| | | |
/s/ Michael Franklin | | Interim Chief Executive Officer and Director | March 13, 2023 |
Michael Franklin | | (Principal Executive Officer) | |
| | | |
/s/ Duane Portwood | | Chief Financial Officer | March 13, 2023 |
Duane Portwood | | (Principal Financial Officer and Principal Accounting Officer) | |
| | | |
| /s/ Irwin D. Simon | | Executive Chairman of the Board of Directors | March 13, 2023 |
| Irwin D. Simon | | | |
| | | |
| /s/ Anuraag Agarwal | | Director | March 13, 2023 |
| Anuraag Agarwal | | | |
| | | |
| /s/ Steven M. Cohen | | Director | March 13, 2023 |
| Steven M. Cohen | | | |
| | | |
| /s/ Denise Faltischek | | Director | March 13, 2023 |
| Denise Faltischek | | | |
| | | |
| /s/ Ira J. Lamel | | Director | March 13, 2023 |
| Ira J. Lamel | | | |
| | | |
| /s/ John M. McMillin | | Director | March 13, 2023 |
| John M. McMillin | | | |