Exhibit (c)(x)

 Confidential - Analysis and Assumptions Subject to Change  Project WORLD  Discussion Materials  January 21, 2024 / Confidential  Jefferies LLC  Member SIPC  The informatiol"I provided in this document including valuation discussions, represents the views of Jefferies Investment Banking There is no assurance that the views expressed herem will beconsistent with the views expressed by Jefferies Research or its Analysts Nothing in this document should be understood as a promise or offer of favorable research coverage  Jefferies  add tag: Exhibit (c)(x)  convert as provided.  please add the tag. [1-39]  add to submission as: EX-99.(c)(x) Description: Exhibit (c)(x) 
 

 Jefferies  Jefferies LLC / January 2024  2  Table of Contents  Confidential -  Analysis and Assumptions Subject to Change  Situation Overview  Public Market Benchmarks  Preliminary Financial Analyses  Appendix  4  12  19  28 
 

 Jefferies  Jefferies LLC / January 2024  2  Disclaimer  Confidential - Analysis and Assumptions Subject to Change  The following pages contain material provided to the Board of Directors (the "Board") of WORLD (the "Company") by Jefferies LLC ("Jefferies") in connection with Project WORLD.  These materials were prepared on a confidential basis in connection with an oral presentation to the Board and not with a view toward complying with the disclosure standards under state or federal securities laws or otherwise. These materials are solely for use of the Board in its evaluation of the proposed transaction and may not be used for any other purpose or disclosed to any party without Jefferies' prior written consent.  The information contained in this presentation was based solely on publicly available information or information furnished to Jefferies by the Company. Jefferies has relied, without independent investigation or verification, on the accuracy, completeness and fair presentation of all such information and the conclusions contained herein are conditioned upon such information (whether written or oral) being accurate, complete and fairly presented in all respects. None of Jefferies, its affiIiates or its or their respective employees, directors, officers, contractors, advisors, members, successors or agents makes any representation or warranty in respect of the accuracy, completeness or fair presentation of any information or any conclusion contained herein. Jefferies, its affiliates and its and their respective employees, directors, officers, contractors, advisors, members, successors and agents shall have no liability with respect to any information or matter contained herein, or any oral information provided herewith or data any of them generates. Jefferies undertakes no obligation to update these materials.  Neither Jefferies nor any of its affiliates is an advisor as to legal, tax, accounting or regulatory matters in any jurisdiction.  This presentation is a preliminary analysis only and does not constitute a fairness opinion of Jefferies as to the value of the Company, and as such, should not be relied upon by the Company or by any other person as such. The financial data, analyses and assumptions reflected here remain subject to refinement and change based on further discussions and information regarding WORLD's businesses and its financial and operating markets. 
 

 Confidential - Analysis and Assumptions Subject to Change  Jefferies  Jefferies LLC / January 2024  2  Situation Overview 
 

 Executive Summary  (1) Reflects an ownership of 8,905,223 shares of WORLD and calculated based on a total basic share count of 42,245,974 as of May 9, 2023.  Confidential - Analysis and Assumptions Subject to Change  On June 21st, 2023, ROSWELL filed an amended 13D jointly with affiliated entities ("Bidder") updating its beneficial ownership to 21.08%m in WORLD  On June 25th, 2023, ROSWELL delivered a non-binding, publicly disclosed proposal (the "Proposal") to the Board of Directors (the "Board") of WORLD, pursuant to which Bidder proposed to enter into a transaction to acquire WORLD and combine it with Royal Oak Enterprises, LLC ("Royal Oak") for cash consideration of $4.00 per share  The Proposal implied a 28.2% premium to WORLD's unaffected stock price of $3.12 on June 23rd, 2023, and a 44.9% premium to WORLD's 3-month VWAP price of $2.76  On June 25th, 2023, WORLD formed a special committee of the Board (the "Special Committee") to review and evaluate the proposal, and subsequently retained Jefferies as financial advisor and announced their strategic review  Jefferies had discussions with ROSWELL and more than 60 additional parties regarding a potential transaction with WORLD  11 parties (plus ROSWELL), all financial sponsors, signed an NOA and received the CIM and VDR access  None of the potential strategic parties progressed to an NOA   After these discussions yielded no additional indications of interest, and following further discussions between the Special Committee, advisors and ROSWELL around valuation and process, WORLD entered into a 45-day exclusivity agreement with ROSWELL on November 15th, 2023, predicated upon ROSWELL's verbal indication of an increase to $4.50 per share and an openness to increasing beyond that level, subject to due diligence  ROSWELL has been conducting (and has now substantially completed) an intensive due diligence process on various functional areas, including Financial, Sales & Marketing, Human Resources, Environmental, and Legal, and has involved its equity and debt financing sources  Source: Company Filings, ROSWELL proposal letter  Jefferies LLC / January 2024  5  Jefferies 
 

 Executive Summary (cont.)  (1) Reflects an ownership of 8,905,223 shares of WORLD and calculated based on a total basic share count of 42,245,974 as of May 9, 2023.  Confidential - Analysis and Assumptions Subject to Change  On December 12th, 2023, ROSWELL submitted a request to extend the exclusivity period to January 15th, 2024 and re-confirmed their prior verbal indication of $4.50 per share, subject to completing due diligence and regulatory agreements  The Special Committee declined to extend exclusivity, considering among other factors the lack of a further increase in the indicated price, but agreed to cooperate with ROSWELL to permit completion of critical due diligence in order to faciliate formulation by ROSWELL of an improved, definitive, and fully-financed proposal  On January 3rd, 2024, Notch View Capital Management, WORLD's second largest shareholder at 5.9%, filed a 13D, urging an immediate sale of the Company at the best price available   Notch View has reiterated its position live to the Special Committee and also stated its willingness to take more aggressive action if a transaction is not consummated  On January 16th, 2024, ROSWELL submitted an updated written indication of interest at $4.50 per share, a draft merger agreement and forms of definitive debt and equity commitments  Subsequently, ROSWELL's equity partner, Rhone Group, verbally indicated to Jefferies openness to a price of $4.75 per share  On January 19th, 2024, principals of WORLD's Special Committee, ROSWELL, Rhone Group and Jefferies met in-person. At the conclusion of the discussions, ROSWELL and Rhone provided a further increased price of $4.875 per share, conditioned on the Special Committee's agreement to recommend the potential transaction to the Board, and stated that it be deemed as their "best and final" offer  ROSWELL has stated that if this best and final proposal is not accepted as a basis for immediately moving to definitive documentation, they intend to withdraw their offer and amend their 13D disclosure accordingly  Over the course of the due diligence process, the Company's 2024P EBITDA expectations have declined from $95M (forecast provided to all interested parties in September) to $91M (updated Management LRP provided to ROSWELL in December) and further to $88M (draft budget level provided verbally on January 19th), while street consensus expectations have increased from $76M to $85M - substantially converging  Source: Company Filings, ROSWELL proposal letter  Jefferies LLC / January 2024  6  Jefferies 
 

 Implied Premiums  WORLD  Stock Price  Premium to Current Stock Price (01/19/24)  $3.84  27.0%  Premium to Publicly Disclosed Offer (6/26/24)  $4.00  21.9%  Premium to 20-Day unaffected VWAP (06/23l3'  $3.05  60.0%  Premium to 90-Day unaffected VWAP (06/23l3'  $2.76  76.6%  Premium to 52-Week High  $4.57  6.7%  Transaction Overview  ($Millions, except per share data)  Confidential - Analysis and Assumptions Subject to Change  WORLD's Board of Directors is considering the potential sale of the ._!P_ro"""p_o_se_d_P_u_rc_h_as_e_P_ri_ce  Company (the "Proposed Transaction") to ROSWELL for a purchase  price of $4.875 per share in cash (the "Proposed Purchase Price")  Diluted Shares Outstandingc1>  - Represents a 60.0% premium to the unaffected share price of  $3.05 (20-day VWAP pre-announcement) and a 21.9% increase to the original publicly-disclosed proposal  - The Proposed Transaction is subject to negotiation of a definitive merger agreement and completion of remaining confirmatory due diligence, which is expected to be completed over the course of the coming week  Jefferies has reviewed the Company's publicly available information and internal financial projections including its long-range plan ("Management LRP") that was finalized as of September 19th, 2023; the Management LRP was subsequently revised on December 4th, 2023, to reflect an updated view of the projection period based on recent YTD performance. A draft of the 2024 budget was received on January 20th, 2024   At the Special Committee's direction, based on the work done to date, the materials included here reflect the following analysis and discussion topics:  Public market perspectives   Preliminary financial analyses of the Company's stand-alone intrinsic value, based on the Management LRP and an analysis of other publicly traded companies and precedent M&A transactions   Supplementary analyses such as an illustrative financial buyer analysis and an M&A Premiums analysis  Implied Equity Value  Plus: Debt {12/31/2023j<2> Less: Cash (12/31/2023)<2>  Proposed Transaction Value  Adj. EBITDA WORLD Statistic TEV / EBITDA   FY2023E  $78.3  8.0x  FY2024P - Street Consensus  $85.2  7.4x  FY2024P - Draft Budget  $88.0  7.lx  FY2024B - Management LRP  $91.1  6.9x  $4._875 !  Jefferies  Jefferies LLC / January 2024  7  46.903  $228.7  428.7  (30.5)  $626.8  Sources: WORLO latest 10-0 filing (Asof September 30, 2023) and Management LRP provided by World management, asapproved by the Special Committee for Jefferies' use.  (I) Includes 42,850,915 common shares (per IOQ as of 9130/2023), 2,223,995 RSUs, 214,556 RSAs, 1,613,409 PSUs(per WORLD equity ledger provided by WORLD Management as of 11/13/2023).  Based on debt balance of $428.7 million and cash balance of $30.5 million as of year end 2023[ per WORLD Management.  VWAP calculated based on calendar days. 
 

 Proposed Transaction Terms  Confidential - Analysis and Assumptions Subject to Change  Proposed Purchase Price  Proposed Structure  I  Financing  $4.875 per share in cash  Reverse Triangular Merger; ROSWELL will cause a subsidiary of Royal Oak ("Merger Sub") to merge with and into the Company, with the Company surviving as an indirect subsidiary of ROSWELL (the "Merger")  Certain Closing Conditions  No Solicitation  Outside Date  Termination Fees  Other  Senior Secured Incremental Term Loan Facility of up to $375 million led by Silver Point as Lead Arranger  Rhone Capital will make a cash equity contribution of between  $275 and $325 million  Requisite Stockholder Approval (majority of all outstanding shares and per Section 203, a 213rd majority of all outstanding shares not owned by ROSWELL and its affiliates)  HSR Approval  No financing condition  No solicitation, subject to fiduciary out  6 months from date of agreement  Company Termination Fee of $20.0 million Parent Termination Fee of $20.0 million  ROSWELL will use R&W Insurance Policy  Source: Proposed merger agreement and debt commitment letter received on January 16, 2024  Jefferies LLC / January 2024  8  Jefferies 
 

 Confidential - Analysis and Assumptions Subject to Change  Summary of Strategic Review Process Outreach and Engagement  Contacted or Inbounded  Engaged with Process  Indications of Interest  Note: Numbers exclude ROSWELL  Jefferies LLC / January 2024  9  Jefferies 
 

 Summary of Buyer Feedback  Confidential - Analysis and Assumptions Subject lo Change  Attractions  Considerations  Jefferies LLC I January 2024  w  Jefferies 
 

 Summary of Outreach  Confidential -  Analysis and Assumptions Subject to Change  '\ --- - - - - - - - - - - - : a_rtJ ieaJ n in_.OSW-ELL-G-r-ou-p-----   ,,,  (1)  (2)  Jette  I January 2024  11  Jefferies 
 

 Confidential - Analysis and Assumptions Subject to Change  Jefferies  Jefferies LLC / January 2024  14  PubIic Market Benchmarks 
 

 WORLD Trading Update  Confidential - Analysis and Assumptions Subject to Change  PubIic Market Perspective  ($Millions, except per share data)  Trading Statistics   ROSWELL   (2)  Unaffected  (3)  Current   ROSWELL   Proposa1t2>  Updated ROSWELL  Indication<•> Final Offer(3)  (6/23/23)  (1/19/24)  (6/26/23)  (1/16/24) (1/19/24)  Share Price  $3.12  $3.84  $4.00  $4.50 $4.875  Shares Outstanding (mm)  44.169  46.903  44.169  46.903 46.903  Market capitalization  $137.8  $180.1  $176.7  $211.1 $228.7  PIUS: Total Debt  439.5  435.6  439.5  435.6 435.6  Less: Cash & cash Eqv.  (26.6)  (24.2)  (26.6)  (24.2) (24.2)  Enterprise Value  $550.7  $591.5  $589.5  $622.4 $640.0  CY2023E Consensus Revenue  $554.9  $546.1  $554.9  $546.1 $546.1  CY2024P Consensus Revenue  $579.1  $572.5  $579.1  $572.5 $572.5  CY2023E Consensus EBITDA  $76.4  $77.8  $76.4  $77.8 $77.8  CY2024P Consensus EBITDA  $83.4  $85.2  $83.4  $85.2 $85.2  Valuation Metrics  EV/ CY2023E Consensus Revenue  0.99x  l.09x<•>  l.06x  l.15xt•>  1.19xt•>  EV/ CY2023E Consensus EBITDA  7.2x  7.7x<•>  7.7x  a.ix'•>  a_3,i•>  EV/ CY2024P Consensus EBITDA  6.6x  7.ox<•>  7.lx  7.4i4)  7.6it•>  Trading Summary  Share Price  Jefferies  Jefferies LLC / January 2024  14  $3.12  $3.84  $4.00  52-Week High  $6.74  $4.57  $6.74  52-Week Low  $2.09  $2.09  $2.09  Current% of 52-Week High  46.3%  84.0%  59.3%  3-M Avg. Daily Vol. ('OOOs) 484.8  Source, Company filings, S&PC..pital IQ as of January 19, 2024. Note: Sharesoutstanding basedon fully diluted shares outstanding.  150.5  486.8  $4.50  $4.72  $2.09  95.3%  162.5  $4.875  $4.57  $2.09  106.7%  150.1  Pro Forma Capitalization Table  9/30/23  Net  Interest  $  %  Leverage  Rate  Maturity  $24.2  Gash and Cash Equivalents  $365.6  83.9%  4.5x  s + 45d'>  2028  Term Loan, due 2028  $70.0  16.1%  5.4x  S+375  2026  Revolving Credit Facility, due 2026  !Total Debt  $435.6  100.0%  5.4x  Based on Adj. EBITDA  as of 9/30/23:  G  ITerm Loan Trading Levels  Price  Yield  Unaffected (6/23/23)  $73.00  16.82%  Current (1/19/24)  $87.70  12.89%  (II Date of 13D public filiog.  Balance sheet details areas of 3/31/2023. Consensusestimates for revenue and EBITDA are as of 6123/2023 and6/26/2023, respectively. Includes 42,245,974 common shares (including 3,000,000 common shares currently held in esaow), 1,162,688 RSUs, 131,470 RSAs, 629,305 PSUs., 19,491,320 public warrants and771,980 private warrants.. Each warrant is exercisable for one.h-alf of oneshare at a strike price of $11.50 per whole share.  Includes 42,850,915 common shares (per lOQas of 9/30/2D23), 2,223,995 RSUs, 214,556 RSAs, 1,613,409 PSUs (per WORLD equity ledger provided byWORLDManagement as of 11/13/2023).  Calculated based on balance sheet details as of 9/30/2023 per latest publicly filed 10-Q. Consensus estimates for revenue and EBITDA are as of 12/14/2023. Includes 42,850,915 common shares (including3,000,000 common shares currently held in  escrow), 2,986,552 RSUs, 257,888 RSAs, 2,355,88D PSUs, 20,193,120 public warrants and70,18Dprivate warrants. Each warrant is exercisable fo, one-llalf of one share at a strike price of $11.50 per whole sh..-e.   During the second quarter of 2023, the Company entered into an interest rate swap agreement to manageexposure to interest rate risk related to the variable portion of its term Joan facility. The agreement converts the variable interest rateon $188.0 million of the term loan (approximately 50% of the notional amount of the facility) to a rate of 4.265% through February 2026. 
 

 Confidential - Analvsis and Assumotions Subiect to Chane:e  WORLD Trading Performance - Public Market Perspective  Stock Price Performance - Since SPAC Closing (June 2020)  Jefferies  Jefferies LLC / January 2024  14  $16.00  $14.00  $12.00  $10.00  $8.00  $6.00  $4.00  $2.00  : ROSWELL Estimated:  1Average Cost-Basis of I  I $5.47 I ShareW I  Current: $3.84 Performance: (62.0%) Median: $7.21  April 18 - May 18, 2022 ROSWELL Begins Purchasing Shares in WORLD  I  jj  I  March 14, 2022 Q4'21 andFull Year Earnings Release  March 13, 2023 ROSWELL  Purchases 1,900,000 Shares. ownership is  -18.33%  I  March 14, 2023 ROSWELL  Purchases 120,000 shares. ownership  is -1.8,.62%  March 15, 2023 ROSWELL  Purchases 580,000  Shares. 130 Filing.  ownership is  -19.99%  June 26, 2023 ROSWELL  Offers $4.00 / Share to Acquire WORLD  June 21, 2023 ROSWELL  Purchases 488,923 Shares.  130 Filing.  ownership is  -21.08%  January 3, 2024 Notch View Capital Management Files  130. ownership is  5.9%  $0.00  Jun-20  Sep-20  Dec-20  Mar-21  Jun-21  Sep-21  6000  5000  4000  3000  2000  11111  1000  Dec-21 Mar-22 Jun-22 Sep-22 Dec-22 Mar-23 Jun-23 Sep-23 Dec-23  -Volume -Price  Source: 130 and Form 4 filings and S&P Capital IQas of January 19, 2024.  Note: Represents Sababa Holdings FREE LLC purchases. Ownership percentage calculations include shares held by Sababa Holdings FREE and those held by Marpet, LLC. ROSWELL is the manager of this entity, and the Trust owns 75% of Marpet. See appendix for further detail.  (1) Weighted average price. 
 

 Confidential - Analysis and Assumptions Subject to Change  LTM Trading Activity  Public Market Views: WORLD -  Market Snapshot  Current  Unaffected Stock Pricem  $3.84  $3.12  30-Day VWAP!2l  $3.43  60-Day VWAP!2l  $3.32  90-Day VWAP!2l  $3.37  180-Day VWAP!2l  $3.45  LTM VWAPl2l  $3.23  52-Week High  $4.57  52-Week Low  $2.09  LTM Incremental Volume Between Price (%)  26.3%  26.7%  29.0%  12.7%  fJ  Offer  I----,  $4.75 Verbal I  1  I  -:.----­  (:  $4.50  ' - - - ...  I  Updated I  ', lndic o _,  _ _ _ _  I  I $4.00 Public I  1  Proposal :  _,  Jefferies  Jefferies LLC / January 2024  16  ,-----,  I $4.875 Final I  Offer :  5.3%  0.0%  0.0%  $2.00 - $2.50  $2.51 - $3.00  $3.01 - $3.50  $3.51 - $4.00  $4.01 - $4.50  $4.51 - $5.00  $5.01 - $5.50  Volume Traded as a% of Float<3>:  0%  34%  105%  177%  255%  271%  271%  Source: S&P Capital IQas of January 19, 2024.  Unaffected stock price as of June 23, 2023.  YWAP calculated based on trading days.  Float defined as 42,850,915 shares outstanding less 8,905,223 shares held by ROSWELL and 2,313,485 shares owned by company employees and individual insiders. Reflectsvolume traded below upper end of range. 
 

 Confidential - Analysis and Assumptions Subject to Change  WORLD Trading Performance - Public Market Perspective  Stock Price Performance - Beginning Two Weeks Prior to ROSWELL Offer (June 26, 2023)<11  Price  -, -------------------------- ':-1a-s,%i-:T-o-a-t-Tr-ad-ed-s;-n'-;e-iio-s--wi-:ii-.o-,,--;,-----------------------------J1  $5.00  $4.50  $4.00  $3.50  $3.00  $2.50  $2.00  $1.50  $1.00  $0.50  , I1   I "T"I   : I I  January 16, 2024 January 19, 2024 January 19, 2024  $4.50 ROSWELL $4.75 ROSWELL $4.875 ROSWELL  Updated Indication Verbal Offer Final Offer  I  August 9, 2023  Q2 Earnings  Release  I--8-7-% -of-Vo-lu-me-h-as-,1  : Traded Below the $4.00 I  I Public Offer, and 100% I  1 has Traded Below the I  I  I  I  I  I  I  I  I  I  I  January 3, 2024 Notch View Capital Management Files 130  June 26, 2023  ROSWELL Offers  $4.00 I Share to Acquire WORLD  ,  _ $4.875 Final Offer _ /  I  November 9, 2023  Q3 Earnings Release; No Material Strategic Review Update Provided  Volume (OOO's)  6,000  5,000  nm  4,000  3,000  2,000  1,000  $0.00 ........... ................._._..._......_......_,.................  Jun-23 Jul-23  Jefferies  Jefferies LLC / January 2024  16  ................ ......._..........._......_......._.._..... ..........._.............................._......_......_......._................_._................. ......._..........._......_........._.._....._........ 0  Aug-23 Sep-23 Oct-23 Nov-23 Dec-23 Jan-24  -Volume -Price  Source: S&P Capital IQ as of January 19, 2024.  (1) Date of 13D public filing. 
 

 Confidential - Analysis and Assumptions Subject to Change  WORLD's Public Shareholder Register Is Comprised of Relatively Aggressive Investors by Majority  I  Rank  Holder Name  Willingness to Challenge Board/ Management  ISS  I nfluencem  Estimated Basis12>  Implied Gain (Loss)12>  Shareholder Since13  >  Current  %0/S  Change Type / Manager vs.Q2'23 Style  1  Notch View Capital Management LLC  a  a  ()  ()  a  a  a  a  a  ()  a  ()  a  ()  ()  .(.)  ()  a  ()  ()  ()  ()  ()  a  a  a  a  a  $3.31  6.6%  Q4'23  5.9%  5.9% Hedge Fund  -H-e-dg-e F-u-nd-.  '1-I-nd-ex----·  (0.1%) Value  Hedge Fund  0.1% Hedge Fund  0.3% Hedge Fund  Hedge Fund (0.1%) Hedge Fund  Value  0.8% -H-e-dg-e F-u-nd-.  '1-I-nd-ex----·  0.3% -H-e-dg-e -Fu-nd-  - '1-Q-u-an-t ---·  0.1% -G-e-ne-ral-ist--  ILI.nd-e-x ----I·  (0.1%) Generalist  Family Office  Hedge Fund .  0.1%  L oaot -  2  Armistice Capital LLC  9.07  (61.1%)  Q3'20  5.0%  3  The Vanguard Group, Inc.  7.43  (52.5%)  Q3'20  4.5%  4  Pacific Ridge Capital Partners LLC  8.38  (57.9%)  Q2'21  3.9%  5  Steel Partners Holdings LP  3.40  3.8%  Q4'22  3.7%  6  Clearline Capital LP  5.02  (29.6%)  Q2 '20  3.6%  7  Ionic Capital Management LLC  5.55  (36.4%)  Q2 '20  3.3%  8  Scoggin Management LP  3.21  10.0%  Q4'22  2.4%  9  Millennium Management LLC  3.34  5.6%  Q3'22  2.0%  10  Brandywine Global Investment Management LLC  9.51  (62.9%)  Q3'20  1.9%  11  Fort Baker Capital Management LP  3.46  2.0%  Q2'23  1.6%  12  BlackRock Fund Advisors  11.90  (70.3%)  Q3 '20  1.5%  13  Hudson Bay Capital Management LP  3.25  8.7%  Q2 '23  1.4%  14  Dimensional Fund Advisors LP  7.90  (55.3%)  Q4 '21  1.1%  15  JPMorgan Investment Management, Inc.  3.18  11.1%  Ql '23  1.1%  16  Geode Capital Management LLC  11.81  (70.1%)  Ql '21  0.8%  17  Russell Investment Management LLC  3.10  13.8%  Ql '23  0.8%  18  RBF Capital LLC  3.10  13.9%  Q2'23  0.8%  19  JPMorgan Alternative Asset Management, Inc.  7.13  (50.5%)  Q4'20  0.7%  20  Renaissance Technologies LLC  6.50  (45.7%)  Q4'21  0.6%  Top 20 Institutional Holders  $5.9314)  (40.4%)  46.5%  Total Index & Quant Fund Ownership  8.5%  Total Insider Ownership  5.4%15)  Index/ Quant funds  are free agents and  Martin Franklin Ownership  20.8%  not "true believers"  Total Hedge Fund Ownership  33.2%  Institutional shareholders are often quiescent unless and until they are offered a perceived "free option" presented by an activist campaign I  Denotes an investor that has been willing to publicly criticize a portfolio company.  Source: FactSet as of 1/1212024. Institutional holdings are based on 13F filings as of 9/3012023 or latest 13G / 13D filings as available.  Note: WORLD share price of $3.53 and market capitalization of $151.3mm. Based on 42.9mm common shares outstanding per the Company's 10-0 filed on 11/9/2023.  (1) Source: ADV filings and personal knowledge of former ISS senior executives at Jefferies.  (2} Per FactSet. Assumes the original value of the investor's holdings adjusted for stock splits, dividends. and capital distributions.  Based on FactSet data dating back through the company's deSPACtransaction in Q2 •20.  Calculated as the average cost basis of the top 20 institutional shareholders, wei,ghted by their respective percentage of shares outstanding. (5} Includes management, directors and non-executive employees. Irwin Simon (executive chairman) owns 3.7%.  Jefferies LLC / January 2024 17  Willingness/ Influence: •  = Greater Q =Less  Jefferies 
 

 Confidential - Analysis and Assumptions Subject to Change  WORLD's Shareholder Base Has Experienced Meaningful Turnover Since the ROSWELL Bid with  Most Buyers Being Hedge Funds  :-- - - -  Shareholder movement analysis from the end of Q2 2023  -, Type/ ManagerI:  %O/S  Top Buy --  Style _ -1  .  Q2'23  Hedge Fund ownership has increased from -25% to  -33% from Q2 to Q3 reporting, and has likely  increased further since that time  Position Chg. (000} %OS Chg. Current  From Q2'23 From Q2'23 %O/S  Notch View Capital Management LLC  Hedge Fund  2,511  5.9%  5.9%  Fort Baker Capital Management LP  Hedge Fund  0.9%  325  0.7%  1.6%  VR Advisory Services (USA) LLC  Hedge Fund  187  0.4%  0.4%  Levin Capital Strategies LP  Value  157  0.4%  0.4%  Gabelli Funds LLC  Generalist  140  0.3%  0.3%  Ionic Capital Management LLC  Hedge Fund  3.0%  138  0.3%  3.3%  Gabelli & Co. Investment Advisers, Inc.  Hedge Fund  131  0.3%  0.3%  Meteora Capital LLC  Hedge Fund  0.1%  130  0.3%  0.4%  Hudson Bay Capital Management LP  Hedge Fund  1.2%  116  0.3%  1.4%  Alden Global Capital LLC  Hedge Fund  0.2%  98  0.2%  0.4%  T  Type/  Mana;, T  %O/S  f Position Chg. (000) T  %OS Chg. T Current  Top Sellers:  Style  I  Q2'23  From Q2'23  I From Q2'23 I  %O/S  Jefferies  Jefferies LLC / January 2024  18  Assenagon Asset Management SA  Index  1.0%  (422}  (1.0%}  Goldman Sachs & Co. LLC  Wealth Mgmt.  1.0%  (394)  (0.9%}  0.1%  Ancora Advisors LLC  Value  1.1%  (225)  (0.5%}  0.5%  Citadel Securities LLC  Broker  0.6%  (212}  (0.5%)  0.1%  Nomura Securities Co., Ltd.  Wealth Mgmt.  0.7%  (104)  (0.3%}  0.5%  First Trust Advisors LP  Generalist  0.2%  (93)  (0.2%}  Squarepoint OPS LLC  Hedge Fund  0.5%  (91)  (0.2%}  0.3%  AQR Capital Management LLC  Hedge Fund  0.2%  (84)  (0.2%}  Susquehanna Financial Group LLLP  Broker  0.3%  (71)  (0.2%}  0.1%  Rubric Capital Management LP  Hedge Fund  0.2%  (71)  (0.2%}  Denotes an investor that has been willing to publicly criticize a portfolio company.  Source: FactSet as of 1/12/2024. 
 

 Confidential - Analysis and Assumptions Subject to Change  Jefferies  Jefferies LLC / January 2024  18  Preliminary Financial Analyses 
 

 Selected Valuation Methodologies  Jefferies  Jefferies LLC / January 2024  18  Confidential - Analysis and Assumptions Subject to Change  Methodology / Consideration  General Description  Comments  Analysis of Selected Publicly Traded Companies   Estimates current market value of WORLD based on trading multiples of selected publicly traded companies generally considered relevant for comparative purposes  Analysis of Selected Transactions   Estimates value of WORLD based on a review of selected merger and acquisition transactions generally considered relevant for comparative purposes  Discounted Cash Flow Analysis   Estimates the value of WORLD based on the present value of the Company's risk-adjusted cash flow  For Reference Only:  DCF - Margin Sensitivity Analysis   Sensitivity on DCF analysis, varying outer year EBITDA margin recovery  Financial Buyer (LBO) Analysis   Analyzes the projected income statement and cash flows to determine a range of prices a third-party financial buyer might potentially pay to acquire the Company  Premiums Paid Analysis   A review, as an additional reference point for informational purposes, of premiums paid in selected M&A transactions involving public companies   Reviewed 11 publicly traded Ingredients & Sweeteners and Packaged Foods companies   Reviewed 16 completed transactions with publicly available information in the Ingredients & Sweeteners and Packaged Foods sectors  Terminal Value calculated using perpetuity growth method   Sensitizes DCF result if LRP margin recovery from recent -14% is limited to less than the planned -18%   Reviewed 184 all-cash transactions across all industries with transaction equity values between $100M and $500M closed since January 1, 2018   Applied relevant premiums to WORLD's unaffected stock price of $3.12 as of 6/23/23 (1-day prior) and WORLD's unaffected stock price of  $2.86 as of 5/26/23 (30-days prior)  Note: Jefferies did not attribute any particular weight to any analysis, methodology Of factor considered by it, but rather made qualitative judgments as to the significance and relevance of each analysis and factor; accordingly, Jefferies' analyses must be considered  as a whole. Considering any portion of the analyses or the factors considered, without considering all analyses and factors, could create a misleading or incomplete view of the process undertaken by Jefferies. 
 

 $2.1 .,...._  I  $2.00 $4 00 $8.00 $10.00   Implied Enterprise Value / EBITDA m   6.4x 7.6x 8.8x 10.0x ll.2x  S.Sx 6.6x 7.6x 8.6x 9.7x  Confidential - Analysis and Assumptions Subject to Change  Preliminary Financial Analyses Summary - Based on Management LRP  C  0  "QI'  "'  a:.i.  iii  C  .0...  "§'  .E  C  Methodology  Selected Public Companies Analysis  (1)  2023E Adj. EBITDA Multiple  (1)  2024P Adj. EBITDA Multiple  (1)  2024 Adj. EBITDA Multiple (Draft Budget)  Selected Transactions Analysis 2023E Adj. EBITDA Multiple<2>  Discounted Cash Flow Analysis Perpetuity Growth Method  (For Reference Only)  DCF- Margin Sensitivity Analysis  Financial Buyer Analysis Historical Premium Analysis  All Industries (1 day)  All Industries (30 days)  Research Target Range 52-Week Trading Range  2023E EBITDA of $78.3M  2024P EBITDA of $91.lM  Metrics  7.6x - 9.2x 2023E Adj. EBITDA 2023E Adj. EBITDA of $78.3M  7.3x - 9.3x 2024P Adj. EBITDA  2024P Mgmt Adj. EBITDA of $91.lM  7.3x - 9.3x 2024P Adj. EBITDA  2024 Budget Adj. EBITDA of $88.0M  7.8x- 9.9x 2023E Adj. EBITDA  - 2023E Adj. EBITDA of $78.3M   Discount rate of 10.5% - 12.0% and perpetuity growth rate of 2.0% - 3.0%   EBITDA margin at 15.0% - 18.0%; Discount rate of 10.5% - 12.0%; Perpetuity growth of 2.5%   20% - 25% IRR, 7.5x- 9.5x exit multiple, 5.0x leverage   25'" and 75th Percentile premiums to unaffected share price ($3.12), 1-day prior to 6/26/23   25'" and 75th Percentile premiums to unaffected share price ($2.86), 30-days prior to 6/26/23  Range of price targets published by research  52-Week intra-day high and low share prices  Source: WORLD latest 10-Q filing (As of September 30, 2023), Management LRPprovided by WORLD management asapproved by the Special Committee for Jefferies' use.  Note: Share prices are rounded to nearest $0.05. Fully Diluted Share Count includes 42,850,915 common shares (per lOQ asof 9/30/2023), 2,223,995 RSUs, 214,556 RSAs, 1,613,409 PSUs (per WORLD equity ledger provided by WORLD Management asof 11/13/2023).  (1) Assumes debt balance of $435.6 million and cash balance of $24.2 million as of Q3 end numbers.  (2) Assumes debt balance of $428.7 million and cash balance of $30.5 million as of year end 2023[ per Management LRP.  Jefferies LLC / January 2024 21  Jefferies 
 

 Confidential - Analysis and Assumptions Subject to Change  Preliminary Analysis of Selected Public Companies - Trading Multiples  EV/ 2023E EBITDA  8.3x 8.lx  ROSWELL ROSWELL  Final Updated  Offer(ll lndicationC2l  $4.875 $4.50  Enterprise $  Value ($Ml 640 $622  7.lx 7.2x  ROSWELL Market  Proposa1<3l Valuation  (Unaffected)<•>  $4.00 $3.12  $590 $551  Ingredients & Sweeteners   Median: 7.6x   7.8x 7.6x  4.3x<5>  TATe.O{LVL.e: )  lngredion  $3,520 $9,337 $5,891  22.6x  bellr1ng  $7,858  Mid-Cap Packaged Foods Median: 11. lx  Simply !utz. Tn•.'elfou,se  $4,376 $2,931 $1,679 $5,802 $3,854 $2,942  $11,966  EV/ 2024E EBITDA  7.6x 7.4x  ROSWELL ROSWELL  Final Updated Offer(l) lndicationC2l  $4.875 $4.50  Enterprise $640 $622  Value ($Ml  7.lx 6.6x  ROSWELL Market Proposa1<•l Valuation  (Unaffected)C4>  $4.00 $3.12  $590 $551  Ingredients & Sweeteners Median: 7.,.,..3,,_x _,  7.4x 7.3x  4.9x<5>  TATe&,t.vL.e ) SU  lngreclion  $3,520 $9,337 $5,891  Mid-Cap Packaged Foods Median: 10.0x  20.3x  bellnng  fu•.-el!on,se -I..cD,-, ......  Si.mply,, g !utz. U: ls:?'f'ers @  $7,858  $4,376 $2,931 $5,802 $1,679 $3,854 $2,942  $11,966  Source: S&PCapital IQ as of January 19, 2024.  Note: Multiples are inclusive of stock-based compensation add backs.  Asof January 19, 2024  Asof January 16, 2024.  Asof June 26, 2023.  As of June 23, 2023.  Proforma for full year for recent announcement of acquisition of remaining stake in CropEnergies AG for €300M on December 19, 2023.  Proforma for full year for recent announcement of acquisition of Petfection Pet Foods for $235M on October 10, 2023.  Jefferies LLC / January 2024 22  Jefferies 
 

 Confidential -  Benchmarking WORLD EV/ NTM EBITDA Multiple Over Time  Analysis and Assumptions Subject to Change  EV/ NTM EBITDA Multiple - Since SPAC Closing (June 2020)  16.0x  14.0x  12.0x  IO.Ox  8.0x  6.0x  4.0x  2.0x  O.Ox ....   Jun-20 Sep-20 Dec-20 Mar-21 Jun-21 Sep-21 Dec-21 Mar-22 Jun-22 Sep-22 Dec-22 Mar-23 Jun-23 Sep-23 Dec-23  -WORLD Ingredients -Mid-Cap Packaged Foods  Mid-Cap Packaged  Jefferies  Jefferies LLC / January 2024  24  1-Year Avg  3-Year Avg  Since June 2020 Avg  7.0x  7.8x  7.6x  6. X  7.6  7.6  12.lx  12.6x  12.Sx  Source: S&P Capital IQ as of January 19, 2024.  Note: Indexes are enterprise value wei,ghted.  Ingredients Index comprised of TATE, INGR and SZU.  Mid-Cap Packaged Focds Index comprised of BRBR, UTZ, SMPL, FLO, THS, HAIN, BGS and POST. 
 

 Confidential -  Preliminary Analysis of Selected Public Companies - Leverage  Jefferies  Jefferies LLC / January 2024  24  Analysis and Assumptions Subject to Change  LTM Net Leverage Ratio  Ingredients & Sweeteners Median: 2.lx  Mid-Cap Packaged Foods Median: 4.2x  6.5x  5.4x  2.5x  2.lx  0  l.6x '  World  TATE 0( LYLE  .,  lngredion  !utz.  Tr•ediouse  bellifng·  Source: Company transcripts and S&P Capital IQ asof January 19, 2024. Note: Net Leverage defined as(Total Debt-Cash)/ LTM EBITDA.  (1) Proforma for recent announcement of acquisition of remaining stake in CropEnergies AG financed by a €300M bridge loan on December 19, 2023. 
 

 )  lngredion  <-->  ♦  PumClrdci  04/08/20 $317 2.6x NA NA  ARDIAN  frulact  01/15/20  €128  l.3x  NA  NA  Confidential - Analysis and Assumptions Subject to Change  Preliminary Analysis of Selected Packaged Foods and Ingredients & Sweeteners M&A Transactions  ($Millions)  Jefferies  Jefferies LLC / January 2024  24  Date Announced  Enterprise EV/ LTM Value Revenue EBITDA  EBITDA  Ma in  Orkla  Ac uiror Ta et  RHO" NE  10/26/23  $1,380 0.9x  NA  NA  (FOOOftgre(lenb  40"JJ.Stake)   KERRY   01/10/23  €500  l.2x  12.2x  10.1%  --  PCl'lfollO)  am1ll111s.i  01/09/23  $40  l.Ox  NA  NA  '":t>rkla  PF  10/03/22  $200  2.0x  13.9x  14.5%  ·:  06/01/22  $503  l.lx  NA  NA  Natra  a;  Gt<'li• •  "-••9ie'°""'  ,111,  05/24/22  $610  2.6x  NA  NA  o,,leloer&&.dk-rlt,S.11,d)  ofi  \Pc.l'HOMPso  04/28/21  $950  NA  ll.5x  NA  -r  0 ,,,,;,..., ,1 \\I  WORLD  w  12/16/20  $18d»  0.9x  7.8x  12.0%  WORLD  81ee/!i:-;5  11/09/20  $80  2.2x  14.8x  15.0%  - --  10/25/20  $550  2.0x  7.9x  25.9%  8._6Fooo1:,INC:.  sovos brands  11al&jsJ-.  08/26/20  $146  2.5x  NA  NA  Act II Global Acquisition  corq  lllVOSld 11,1♦  12/19/19  $516  l.9x  8.2x  23.0%  WORLD  -·:  Natra  01/02/19  $215  0.5x  5.5x  9.0%  ♦  '-$  09/20/18  $100  0.7x  NA  NA  1 "'  l.6x  10.2x  :- ,  l.3x  9.9x  Source: Company filings, S&P Capital IQ, Mergermarket and Jefferies IB estimates.  (1) Excludes $55M earn out. 
 

 2.0%  $8.65  $7.25  $6.05  2.5%  $9.50  $7.90  $6.60  3.0%  $10.40  $8.70  $7.25  Discounted Cash Flow Sensitivity Analysis  Confidential - Analysis and Assumptions Subject to Change  - -  -  Implied Terminal EBITDA Multiplem  II  Perpetuity  Discount Rate  II  Growth  I  2.0%  2.5%  3.0%  lx 8.7x  3x  7.5x  8.0x  8.5x  7.0x  7.4x  7.8x  Margin(%)  10.50%  11.25%  12.00%  15.0%  $6.00  $4.75  $3.75  16.5%  $7.85  $6.45  $5.25  18.0%  $9.70  $8.15  $6.80  (1) Calculated based on EBITDA net of Stock based Compensation  Jefferies  Jefferies LLC / January 2024  26  Source: Management LRP provided by WORLD management as approved by the Special Committee for Jefferies' use. Note: Share prices in sensitivity table are rounded to nearest $0.05. DCF assumes valuation as of Oecember 31, 2023. 
 

 Preliminary Discounted Cash Flow Analysis  ($Millions)  Confidential -  Analysis and Assumptions Subject to Change  Unlevered Free Cash Flows  I  --•--  -  Revenue EBITDA  % Margin  Less: Stock-based Compensation<ll EBITDA (net of SBC)  % Margin  Less: D&A Less: Otherl21  EBIT  Less: Taxes<11  Net Operating Profit After Tax (NOPAT) Plus: D&A'41  Less: NWC (Increase) / Decrease Unlevered CFO  Less: Capex Unlevered FCF  % Conversion  Time Until End of FY Discount Period Discount Factor  $567.1  $91.1  16.1%  (6.6)  $84.5  14.9%  (25.1)  (3.0)  $56.4 (34.4)  $22.0 25.1  0.0  $47.1 (7.5)  $39.6  43.4%  1.0  0.5  94.8%  $599.3  $100.7  16.8%  (6.2)  $94.5  15.8%  (24.9)  $626.3  $108.8  17.4%  (6.7)  $102.1  16.3%  (24.6)  $654.4  $115.8 17.7%  (6.8)  $109.0  16.7%  (23.4)  $683.9  $123.2  18.0%  (7.1)  $116.1  17.0%  (21.4)  $69.6 (29.2)  $40.4 24.9  (3.5)  $61.7 (7.9)  $53.8  53.4%  2.0  1.5  85.2%  $77.5 (25.5)  $51.9 24.6  (6.1)  $70.4 (8.3)  $62.2  57.1%  3.0  2.5  76.6%  $85.6 (23.4)  $62.2 23.4  (6.8)  $78.8 (8.7)  $70.1  60.6%  4.0  3.5  68.9%  $94.7 (22.2)  $72.5 21.4  (7.1)  $86.7 (9.0)  $77.7  63.1%  5.0  4.5  61.9%  !Present Value of Unlevered FCF  $37.5  $45.8  $47.6  $48.3  $48.11  Tenninal Value at 2.5% Growth Rate  !Present Value of Tenninal Value<si  Sum of PV of Unlevered FCF Total Enterprise Value  Plus: Cash Less: Debt Equity Value  rnso<•1  IImplied Price Per Share  4.8%  7.8%  8.3%  $683.9  $123.2  18.0%  (7.1)  $116.1  17.0%  (9.0)  13.8%  $107.0 (25.1)  34.7%  $81.9 9.0  (7,1)  16.5%  $83.8 (9.0)  $74.8  60.7%  $924.2  $542.31  227.4  $769.7 30.5   (428.7)  $371.5 46.903  $7.921  Source: Management LRP provided by WORLD management as approved by the Special Committee for Jefferies' use. Note: Share prices in sensitivity table are rounded to nearest $0.05. OCF assumes valuation as of December 31, 2023.  Stock-based compensation based on management forecast provided by WORLD management.  Other reflects expenses related to Supply Chain Reinvention program.  WORLD cash tax rates per WORLD management, terminal year effective tax rate of -23% based on 2028 forecast.  Depreciation & amortization is equal to Capex in the terminal year.  Based on illustrative perpetuity growth rate of 2.5%. Based on illustrativediscount rate of 11.25%. Assumes mid-year convention.  Includes 42,850,915 common shares (per lOQ as of 9/30/2023), 2,223,995 RSUs, 214,556 RSAs, 1,613,409 PSUs(per WORLD equity ledger provided by WORLD Management as of 11/13/2023).  Jefferies LLC / January 2024 27  Jefferies 
 

 Confidential - Analysis and Assumptions Subject to Change  Jefferies  Jefferies LLC / January 2024  30  Appendix 
 

 Confidential - Analysis and Assumptions Subject to Change  Illustrative Financial Buyer Analysis (For Reference Only)  ($Millions, except per share data)  Illustrative transaction date of 12/31/2023   Assumes Management LRP for 2023E-2028E  Adjusted EBITDA includes  $4.5 million of annual PubCo savings   Management promote of 10% assumed   Tax rate assumption per management forecast (-23% by 2028E)   FD shares of 46.9 million at transaction, reflective of outstanding warrants, RSUs, RSAs, and PSUs<ll   Pro forma leverage of 4.5x 2023E Adj. EBITDA  New $390 million First Lien Term Loan, S +CSA+ 500, 98.0 0ID, 0.75%  Floor   Assumes 3-month SOFR and 15 bps CSA  Mandatory amortization of 1.00%  Sources of Funds  Jefferies  Jefferies LLC / January 2024  30  Buyer Equity Contribution  Transaction Debt  $302  $390  Uses of Funds  Purchase of Equity ($4.875 / sh)  $398  $27  $8  $31  Repayment of Existing Net Debt  Transaction Fees& Expenses 01DI Upfront Fees  Cash to Balance Sheet Total Uses  $692  Transaction Sources and Uses Pro Forma Financial Summary Assumptions  Net Sales  $551  $567  $599  $626  $654  $684  YIYGrowth  1.5%  4.8%  4.5%  4.5%  4.5%  4.5%  Standalone Adj. EBITDA  78  91  101  109  116  123  PubCo Expense Savings   5 5 5 5 5   Total Sources  $692  Adjusted EBITDA  $78  $96  $105  $113  $120  $128  % Margin  14.2%  16.9%  17.6%  18.1%  18.4%  18.7%  Other2l CapEx  (3)  (8)  (8)  (8)  (9)  (9)  $229  Change in Working capital  (4)  (6)  (7)  (7)  Cash Interest Expense  (32)  (28)  (24)  (18)  (12)  (4) (4) (4)  (4)  (4)   (29) (24) (20) (19) (20)  390 I  $21  331  $38  289  $51  234  $64  166  $76  86  $390  30.5  $331  30.5  $289  30.5  $234  30.5  $86  30.5  Mandatory Amortization Cash Taxes  Excess Cash Flow  New First Lien Term Loan Total Debt  Cash Balance  Total Leverage Net Leverage  5.0x  4.lx  3.5x  3.lx  2.7x  2.5x  2.lx l.8x  $166  30.5  1.4x  1.lx  0.7x  0.4x  Adj. EBITOA / Net Int. Exp.  3.0x  3.7x  4.8x  6.6x  11.0x  (Adj. EBITDA - CapEx) / Net Int. Exp.  2.Bx  3.5x  4.4x  6.lx  10.2x  Sensitivity Analysis  I •1 •  '  .  '  20.0%  22.5%  25.0%  22.5%  25.0%  7.5x  $4.90  $4.20  $3.55  4.0x  $5.45  $4.65  $3.90  8.5x  $5.90  $5.10  $4.35  4.5x  $5.90  $5.10  $4.35  9.5x  $6.85  $5.95  $5.20  5.0x  $6.25  $5.45  $4.80  ••  ' .  20.0%  22.5%  25.0%  15.0%  $3.60  $3.05  $2.50  16.5%  $4.60  $3.95  $3.35  18.0%  $5.60  $4.80  $4.15  Source: Management LRP provided by WORLD management as approved by the Special Committee for Jefferies' use.  Includes 42,850,915 common shares(per lOQas of 9/30/2023), 2,223,995 RSUs, 214,556 RSAs, 1,613,409 PSUs(per WORLD equity ledger providedby WORLD Management as of 11/13.'2023).  Other reflects expenses related to Supply Chain Reinvention program. 
 

 One-Day & 4-Week Premiums Selected Statisticsm  75%  60%  E 45%  .:E:,  .,  ct 30%  20% 21%  15%  0% -+------  25th Percentile  38%  One-Day Premium  40%  Median  4-Week Premium  63% 65%  75th Percentile  One-Day & 4-Week Premiumsm  45%  >- 30%  .C,:  (.)  ::,  Sf  .z 15%  7.6% 8.2%  0%  7.6% 5.4%  0-10%  39.7%  33.7%  14.7%14.1% 13.6o/°J. l.4%  10.3%10.3%  12.5o/"10.9%  10-20% 20-30% 30-40%  40-50%  50%+  Premium Intervals  One-Day Premium 4-Week Premium  Confidential - Analysis and Assumptions Subject to Change  Jefferies  Jefferies LLC / January 2024  30  Illustrative Premiums Paid Analysis - Equity Values $ l00M - $500M (For Reference Only)  U.S. and Canada All Cash M&A Majority Transactions, Announced Since January 2018  Source: Thomson Reuters as of January 19, 2024.  (1} 4-week premium based on closing stock price 4 weeks prior to announcement. 
 

 Announcement  Date  ImpliedEnterpriseValue  ($mil)  PriceBump<2>  Premiu  I-Day  m Premium  1-Mo.  03/17/23  $2,534  0%  32%  (0%)  12/12/22  $3,700  29%  24%  15%  11/15/21  $330  (15%)  94%  64%  06/19/21  $13,700  25%  61%  59%  05/06/21  $4,214  19%  18%  37%  Confidential - Analysis and Assumptions Subject to Change  Consumer I Retail US Sponsor-Led Take-Private Transactions Over $200M<1>  Consortium led by Management Group  () BDT&MSD  Casper   DU RAT! ON AL   CAPITAi. MAl'-'ACEMEl\l  •.':•.•-.  ■  Morrisons  ath•me  Hellman &Friedman  The Honu!DecorSupento  Nlu:ha&s  ®  APOLLO  ICATTERITON  IIIIWII  APOLLO  DURAT)ONAL  t:.'itllAL MA A(;[M[t-l  03/03/21  $3,222  0%(4)  22%  44%  06/24/19  $622  (11%)(5)  19%  15%  BARNES&NOBLE  06/07/19  $670  0%  9%*  28%  Smart&Final.  04/17/19  $1,119  0%(6)  21%*  27%  11/06/18  $736  (8%)  1%*  (2%)  09/25/18  $2,249  2%(7)  19%  26%  02/20/18  $560  5%(8)  25%  15%  07/09/17  $2,180  10%(9)  31%  25%  06/29/17  $337  27%  34%  31%  12/07/15  $13,900  8%  78%  76%  mg  ROARK  CAl'lTAL GROul'  ,  .  FOCO oECHAO  A  RHONE  BUllU\N Slt.--\KHOUSE  CLUBCORP.  y,.. \IIOotU> 1.,.,.1'<-ot 11<f'ot• .-... C.,y-•11•  APOLLO  9t''2 M y  JAB  UOLUIM,  Co..,,...s.,.  Mean:  $3,338  6.1%  32.5%  30.7%  Median:  $2,180  1.8%  23.8%  27.2%  Source: Thomson SOC, S&P Capital IQ and Company Filings.  West Marine·  i{EURICi  GRf[H MOUMTAIM  Note: Represents transaction wasleaked before announcement. (5)  (1) Includes US sponsor-led leveraged buyouts with transaction values greater than $200 million since 1/1/2013.(6)  Based on price bump of final offer price to initial offer price.  Casper had negative EBITOA at time of transaction.  Initial offer price used represents midpoint of initial offer range provided of $14.00 • $15.00.  Jefferies LLC / January 2024  Initial offer price used represents midpoint of initial offer range provided of $9.50 • $10.00. Initial offer price used represents midpoint of initial offer range provided of $7.00 - $8.00.  Initial offer price used represents midpoint of initial offer range provided of $37.00- $40.00.  Initial offer price used represents midpoint of initial offer range provided of $12.00 • $13.00.  Initial offer price used represents midpoint of initial offer range provided of $17.25 • $19.00.  31  Jefferies 
 

 Analyst Estimates  Date  Firm  Recommendation  Price Target  Valuation  Methodology  FY2023E  FY2024E  Revenue I  EBITDA  Revenue I  EBITDA  11/09/23  Canaccord Genuity LLC  Buy  $5.00  8.3x FY2024E EBITDA  $545  $78  $570  $85  11/09/23  Imperial Capital  Outperform  $9.00  IO.Ox FY2023E EBITDA  $548  $78  $579  $81  11/09/23  Lake Street  Buy  $6.00  8.5x FY2024E EBITDA  $540  $77  $563  $86  Analyst Consensus  $6.6il)  $546  $78  $573  $85  Management LRP  $55il2l  $7sl2l  $56i2l  $9il2l  Confidential - Analysis and Assumptions Subject to Change  WORLD Research Coverage and Estimates (For Reference Only)  One-Year Stock Price Performance (01/19/24)  Price  $12.00  $10.00  $8.00  $6.00  $4.00  $2.00  $0.00  Jan-23  Feb-23 Mar-23  Apr-23  May-23 Jun-23 Jul-23 Aug-23 Sep-23  -Share Price -Research Analysts' Price Target  Oct-23  Nov-23  Dec-23  Jan-24  Source: Wall Street research and S&P Capital IQas of January 19, 2024.  Mean of price targets from research reports noted above.  Management LRP provided by WORLD management asapproved by the Special Committee for Jefferies' use.  Jefferies LLC / January 2024  32  Jefferies 
 

 Company Name  Mid-tap Packaged Food  Equity  Value  Total  Net Debt  Minority  Interest  Total  cap.  D/E  Ratio  Net Debt/  Total cap.  Tax Rate  Beta<u  Unlevered  Beta  Adjusted  Lev. Beta  BellRing Brands, Inc.  $7,041  $817  $23  $7,880  11.6%  10.4%  25.0%  0.83  0.76  1.13  The Hain Celestial Group, Inc.  902  777  $11  1,690  86.1%  45.9%  25.4%  0.99  0.60  0.89  B&G Foods, Inc.  796  2,146  $9  2,952  269.5%  72.7%  32.5%  0.86  0.30  0.44  The Simply Good Foods Company  4,223  154  $18  4,394  3.6%  3.5%  25.4%  0.62  0.60  0.89  Post Holdings, Inc.  5,766  6,191  $9  11,966  107.4%  51.7%  25.0%  0.63  0.35  0.52  TreeHouse Foods, Inc.  2,313  1,541  $10  3,864  66.6%  39.9%  30.5%  0.61  0.42  0.60  Utz Brands, Inc.  1,336  865  $16  2,217  64.7%  39.0%  30.0%  0.80  0.55  0.80  Flowers Foods, Inc.  4,779  1,023  $11  5,813  21.4%  17.6%  26.8%  0.54  0.46  0.68  Ingredients & Sweetners  Siidzucker AG  $2,876  $1,944  $4  $4,824  67.6%  40.3%  15.8%  0.40  0.25  0.39  lngredion Incorporated  7,253  2,071  8  9,332  28.6%  22.2%  30.5%  0.64  0.54  0.78  Tate & Lyle pie  3,217  302  8  3,527  9.4%  8.6%  25.0%  0.52  0.49  0.73  Mean  3,682  1,621  12  5,315  67.0%  32.0%  26.5%  0.68  0.48  0.71  Median  3 217  1023  10  4 394 64.7%  39.0%  25.4%  0.63  0.49  0.73  !WORLD (Current Debt)  $186  $398  $8  $592  214.0%  67.3%  30.5%  0.88  0.35 0.881  !woRLD (Illustrative Normalized Debt)Ul  $357  $235  $8  $592  65.8%  39.7%  30.5%  I  WORLD  Selected Peers  Illustrative Range  Risk-freeRate<Rfl'"  4.5%  4.5%  4.5%  4.5%  4.5%  Unlevered Beta  0.35  0.35  0.49  0.50  0.35  @:n>everedBela 0.35 0.35     0.49 0.50 0.35]  Adj. levered Beta  0.86  0.52  0.72  0.62  0.51  Oebt I Equity Ratio  205.5%  65.8%  64.0%  33.3%  66.7%  Multiplied by: Market Risk Premium (Rm)  7.2%  7.2%  7.2%  7.2%  7.2%  Adj. Levered Betal4)  0.86  0.52  0.72  0.62  0.51  Adjusted Equity Risk Premium  6.2%  3.7%  5.2%  4.4%  3.7%  Market Risk Premium(Rm)t  7.2%  7.2%  7.2%  7.2%  7.2%  Plus: Risk-Free Rate (Rf)  4.5%  4.5%  4.5%  4.5%  4.5%  Size Premium {Rs>'"  4.8%  4.8%  4.8%  4.8%  4.8%  Plus: Size Premium (Rs)  4.8%  4.8%  4.8%  4.8%  4.8%  Tax Rate"'  30.5%  30.5%  25.4%  30.5%  30.5%  Cost of Equity (Ke)  15.5%  13.0%  14.5%  13.7%  13.0%  Pre-TaxCostofOebt(Kdl'8J  12.9%  10.0%  10.0%  10.0%  10.0%  Multiplied by: E / (D+E)  32.7%  60.3%  61.0%  75.0%  60.0%  AssumedAfter-taxCostofOebt  9.0%  7.0%  7.5%  7.0%  7.0%  Cost of Equity Portion  5.1%  7.8%  8.8%  10.3%  7.8%  Weighted Average Cost of Capital  ($Millions, except per share data)  Confidential -  Analysis and Assumptions Subject to Change   Selected Companies   WACC Assumptions  iA'ssumedNetOebt/TotalGapital'" :::::: 67.3% :::397% ::  390%:::: 250%:::: 40.0%!   WACC Calculation   After-TaxCost of Debt Multiplied by: D / (D +E)  9.0%  67.3%  7.0%  39.7%  7.5%  39.0%  7.0%  25.0%  7.0%  40.0%   Cost of Debt Portion 6.0% 2.8% 2.9% 1.7% 2.8%  IWACC 11.1% 10.6% 11.8% 12.0% 10.6%1  Source: Public filings, Wall Street equity research, Kroll, Bloomberg. Note: Market data as of January 19, 2024.  (I) 2-year weekly adjusted betas sourced from Bloomberg as of January 19, 2024.  (2) Normalized per WORLD management (reflects leverage of 3.0x LTM EBITDA). (3)  (4)  (5)  (6)  (7)  (8)  (9)  Spot rate for 20-Year US Treasury Yield as of January 19, 2024.  Adjusted for WORLD debt/ capital ratio and median debt I capital ratio for selected comparable companies. Represents long-horizon expected equity risk premium per Kroll Cost of Capital Navigator.  Size premium based on 10th decile for market capitalizations from Kroll Cost of Capital Navigator.  WORLD tax rate (calculated as the sum of US Federal and State statutory taxrates). Median marginal taxrate used for selected comparative companies. Based on the current yield of WORLD's existing debt as of January 19, 2024 (-12.9%) and expected incremental debt yield at normalized levels (10.0%).  WORLD normalized debt/ capital ratio and median debt I capital ratio for selected comparative companies.  Jefferies LLC / January 2024 33  Jefferies 
 

 Confidential - Analysis and Assumptions Subject to Change  Selected Changes Between Special Committee Presentation on October 16, 2023 and January  12, 2024  Topic Summary Changes  Share Count  Reduction in diluted share count by 1.532 million units  WORLD Management LRP  Updated WORLD Management LRP (2023E - 2028E) as of December 4th, 2023   2023E Revenue down to $549.6 million from $550.6 million (2024E-2028E down -$11 - 14 million annually)   2023E Adjusted EBITDA down to $78.0 million from $79.3 million (2024E-2028E down -$2 - 4 million annually)  2023E Change in NWC up to $4.2 million from ($8.7) million, 2024E down to $0.0 million from $1.9  2023E Cash-related addbacks (inclusive of Supply Chain Reinvention) up to $16.4 million from $13.4 million, 2024E up to $3.0 million from $2.0 million  Selected Other Changes  - 2023E CAPEX down to $6.4 million from $7.0 million, 2024E down to $7.5 million from $8.7 million (2025E-2028E down -$1.0 million annually)  Updated Debt Repayment Schedule based on WORLD Management LRP  2023E ending Debt balance down to $428.7 million from $436.7 million  2023E ending Cash balance up to $25.9 million from $23.8 million  The following items were updated per current market data:  Increase in EV/ 2023E EBITDA selected companies trading multiples range from 7.0x - 9.0x to 7.5x - 9.4x  Increase in EV/ 2024E EBITDA selected companies trading multiples range from 6.8x - 8.8x to 7.lx - 9.4x  Decreased WACC range from 11.00% - 12.50% to 10.50% - 12.00%  - Decrease in 20-year U.S. Treasury Yield from 5.0% to 4.3%  Jefferies LLC / January 2024  34  efffiles 
 

 Confidential - Analysis and Assumptions Subject to Change  Selected Changes Since Special Committee Presentation on January 12, 2024  Summary Changes  Trading Multiples  Change in EV/ 2023E EBITDA selected companies trading multiples range from 7.5x - 9.4x to 7.6x - 9.2x  Change in EV/ 2024E EBITDA selected companies trading multiples range from 7.lx - 9.4x to 7.3x - 9.3x  2023E  Financial Update from  Jefferies  Jefferies LLC / January 2024  35  Management  The following items were updated per current market data:  2023E Adjusted EBITDA increased from $78.0M to $78.3M  2023E Cash increased from $25.9M to $30.5M 
 

 Confidential - Analysis and Assumptions Subject to Change  Jefferies  Jefferies LLC / January 2024  35  Historical and Projected WORLD Financial Summary  Historical Management Forecast CAGR  ($Millions)  FY2021A  FY2023E  FY2024E  FY2025E  FY2026E  FY2027E  FY2028E  '23E - '28E  Revenue  Branded CPG  $410  $423  $426  $435  $456  $476  $498  $520  4.1%  Flavors & Ingredients  105  116  125  132  144  150  157  164  5.6%  Total Revenue  $514  $538  $551  $567  $599  $626  $654  $684  4.4%  % Growth  4.7%  2.3%  2.9%  5.7%  4.5%  4.5%  4.5%  Adjusted Gross Profit  Branded CPG  133  117  110  126  134  142  148  155  7.0%  Flavors & Ingredients  41  50  57  60  66  69  72  75  5.6%  Total Adjusted Gross Profit  $174  $167  $167  $186  $200  $210  $220  $230  6.5%  % Margin  33.9%  31.1%  30.4%  32.8%  33.4%  33.6%  33.6%  33.6%  Operating Expenses  Branded CPG  (62)  (54)  (53)  (57)  (61)  (62)  (64)  (66)  4.5%  Flavors & Ingredients  (11)  (12)  (13)  (13)  (13)  (13)  (14)  (14)  0.8%  Corporate  (20)  (23)  (23)  (25)  (25)  (26)  (26)  (27)  3.2%  Total Operating Expenses ($92)  ($88)  ($89)  ($95)  ($99)  ($102)  ($104)  ($107)  3.7%  Adjusted EBITDA  Branded CPG $72  $64  $58  $69  $74  $80  $84  $89  9.1%  Flavors & Ingredients  30  38  44  47  52  55  58  61  6.9%  Corporate  (20)  (23)  (23)  (25)  (25)  (26)  (26)  (27)  3.2%  jTotal Adjusted EBITDA  $82  $79  $78  $91  $101  $109  $116  $12311  9.5%  % Margin  16.0%  14.7%  14.2%  16.1%  16.8%  17.4%  17.7%  18.0%  Memo: Supply Chain Reinvention Addbacks  8  23  12  3  NIA  Total Capital Expenditures  $12  $9  $6  $8  $8  $8  $9  $9  7.2%  % of Total Revenue  2.4%  1.7%  1.2%  1.3%  1.3%  1.3%  1.3%  1.3%  Source: Management LRP provided by WORLO management, as approved by the Special Committee for Jefferies' use on January 20, 2024. 
 

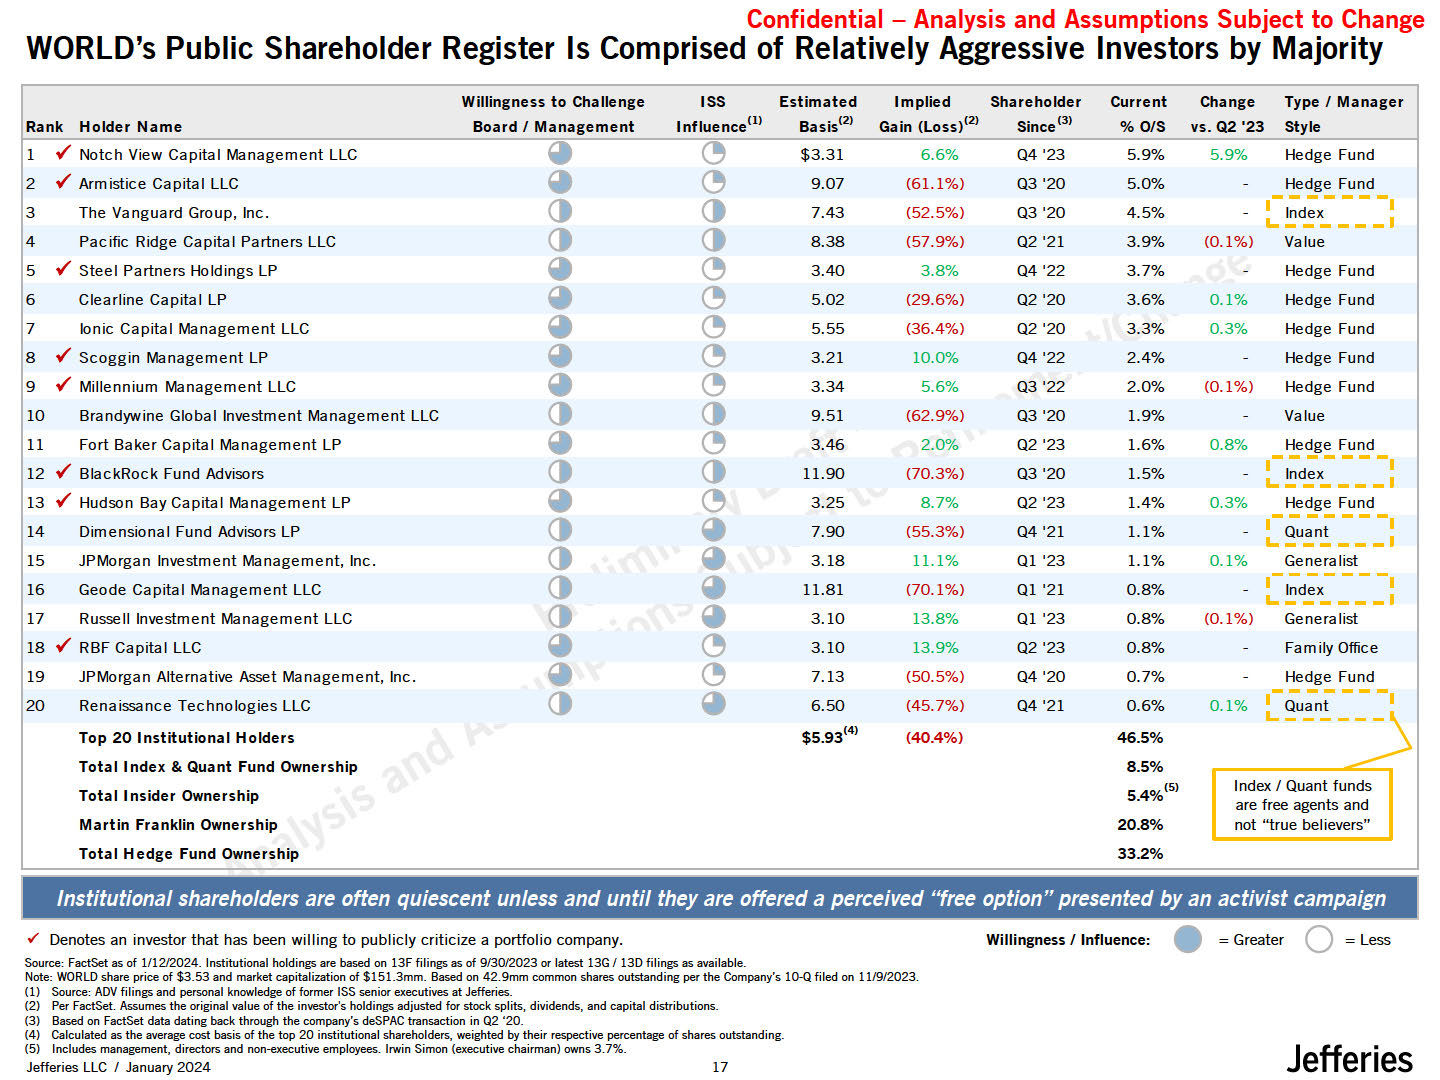
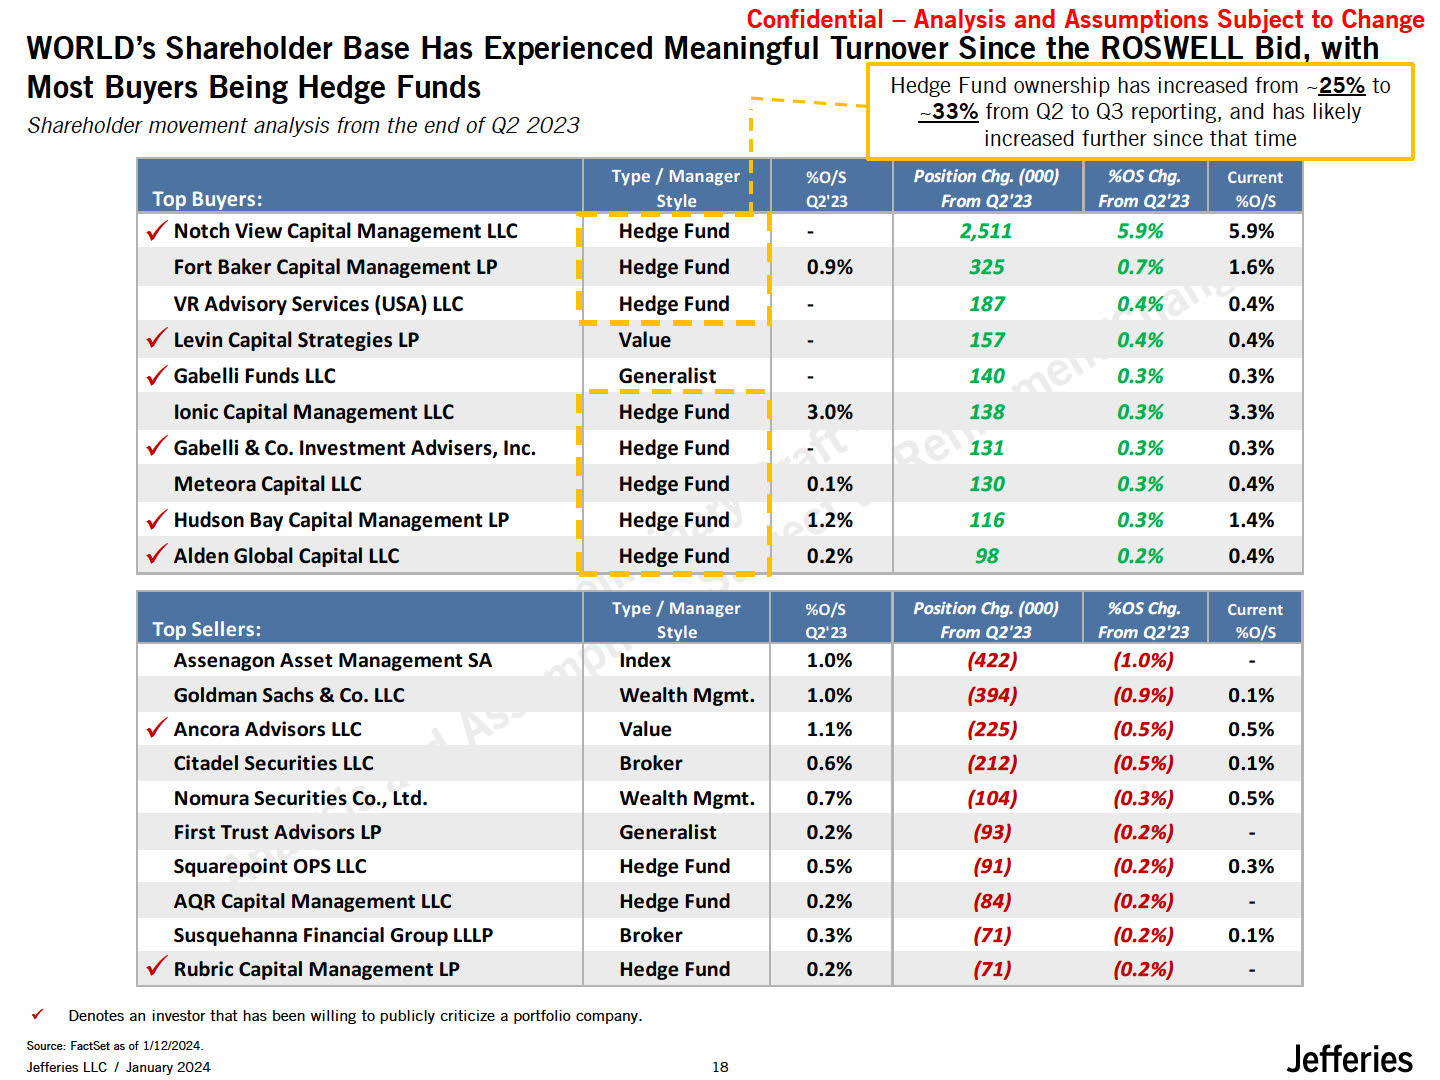
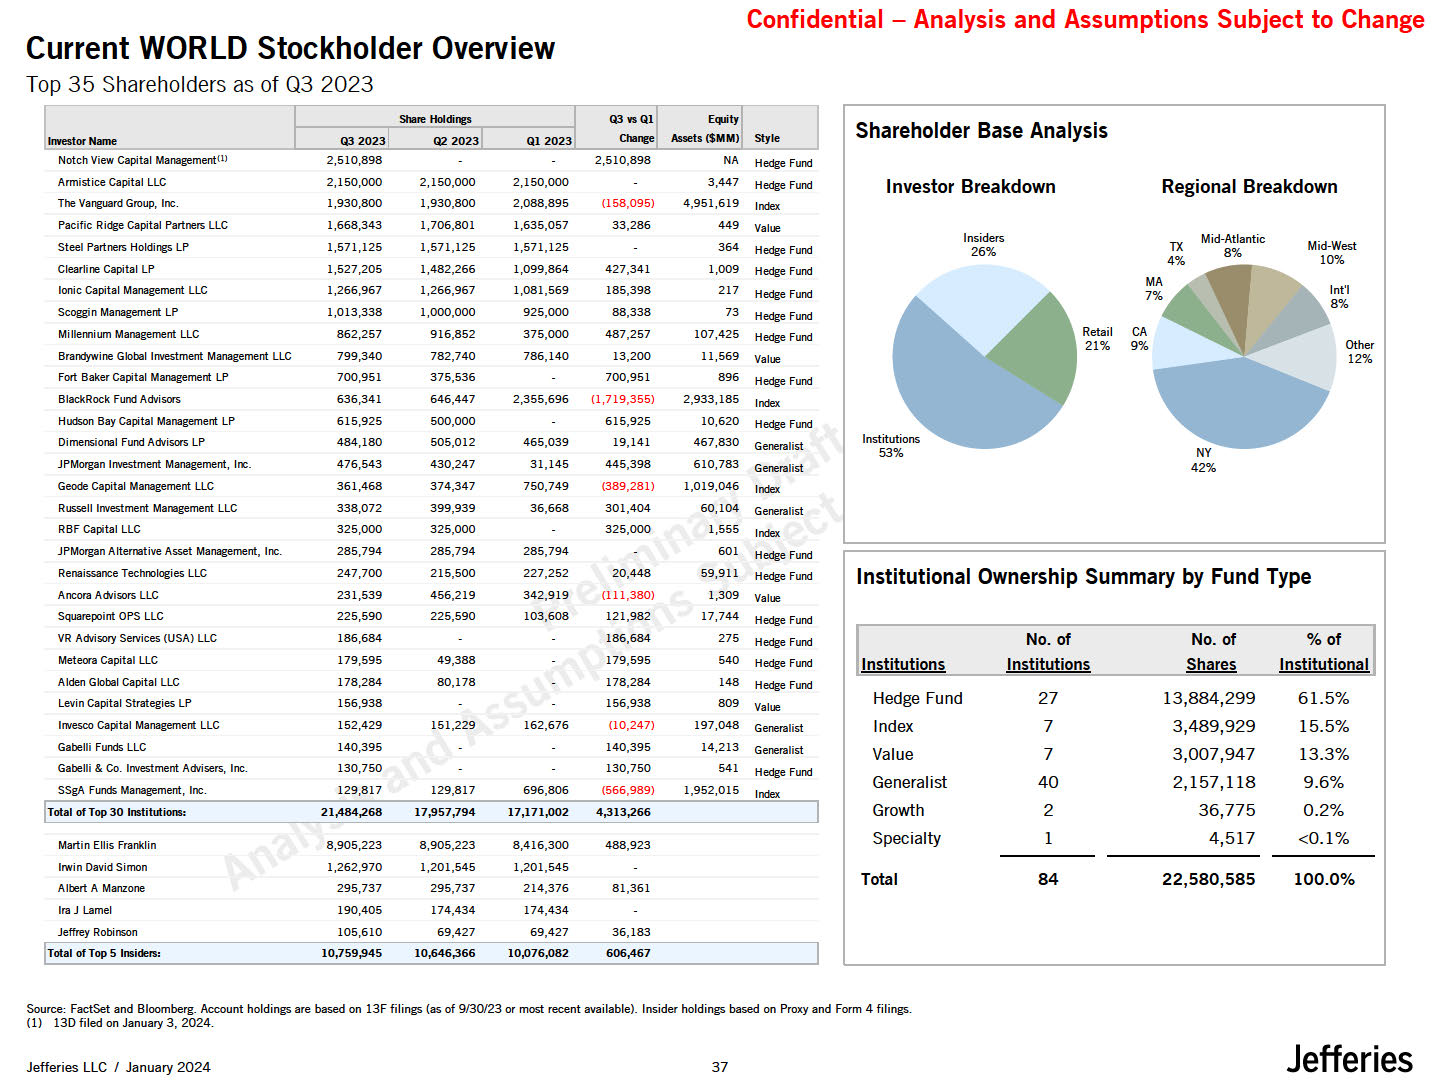
  Share tto1dirvs   Q3 vsQl  E(Jlity  lnw:stor Name  Q3 2023  Q2 2023  Cha  Auets ($MM)  style  Notch View Capital ManagementU>  2,510,898  2,510,898  NA  Hedge Fund  ArmisticeC..pital LLC  2,150,000  2,150,000  2,150,000  3,447  Hedge Fund  The VanguardGroup, Inc.  1,930,800  1,930,800  2,088,895  (158,095)  4,951,619  lndeo<  Pacific Ridge Capital Partners LLC  1,668,343  1,706,801  1,635,057  33,286  449  Value  Steel Partners Holdings LP  1,571,125  1,571,125  1,571,125  364  Hedge Fund  ClearlineCapital LP  1,527,205  1,482,266  1,099,864  427,341  1,009  Hedge Fund  Ionic Capital Management LLC  1,266,967  1,266,967  1,081,569  185,398  217  Hedge Fund  Scoggjn Management LP  1,013,338  1,000,000  925,000  88,338  73  Hedge Fund  Millemium Management LLC  862,257  916,852  375,000  487,257  107,425  Hedge Fund  BrarxtywineGlobal Investment Management LLC  799,340  782,740  786,140  13,200  11,569  Value  Fort Baker Capital Management LP  700,951  375,536  700,951  896  Hedge Fund  BlackRock FundAdvisors  636,341  646,447  2,355,696  (1,719,355)  2,933,185  lndeo<  Hudson BayC..pital Management LP  615,925  500,000  615,925  10,620  Hedge Fund  Dimensional FundAdvisorsLP  484,180  505,012  465,039  19,141  467,830  Generalist  JPMorgan Investment Management, Ire.  476,543  430,247  31,145  445,398  610,783  Generalist  Geode Capital Management LLC  361,468  374,347  750,749  (389,281)  1,019,046  lndeo<  Russell Investment Management LLC  338,072  399,939  36,668  301,404  60,104  Generalist  RBF Capital LLC  325,000  325,000  325,000  1,555  lndeo<  JPMorgan Alternative Asset Management. loc.  285,794  285,794  285,794  601  Hedge Fund  Renaissance Technologies LLC  Ancora Advisors LLC  247,700  231,539  215,500  456,219  227,252  342,919  20,448  (111,380)  59,911  1,309  Hedge Fund Value  Institutional Ownership Summary by Fund Type  Squarepoint OPS LLC  225,590  225,590  103,608  121,982  17,744  Hedge Fund  VR AdvisoryServices(USA) LLC  186,684  186,684  275  Hedge Fund  Institutions  No. of  Institutions  No. of  Shares  %of  InstitutionaI  Meteora Capital LLC  179,595  49,388  179,595  540  Hedge Fund  AldenGlobal Capital LLC  Levin Capital StrategiesLP  178,284  156,938  80,178  178,284  156,938  148  809  Hedge Fund  Value  Hedge Fund  27  13,884,299  61.5%  InvescoCapital Managemert LLC  152,429  151,229  162,676  (10,247)  197,048  Generalist  Index  7  3,489,929  15.5%  Gabelli FundsLLC  Gabelli & Co. Investment Advisers, Inc. SSgA FundsManagement, Inc.  140,395  130,750  129,817  129,817  696,806  140,395  130,750  (566,989)  14,213  541  1,952,015  Generalist  Hedge Fund lndeo<  Value  Generalist  7  40  3,007,947  2,157,118  13.3%  9.6%  Total ofTop30 lnstitutioos:  21,484,268  17,957,794  17,171,002  4,313,266  Growth  2  36,775  0.2%  Martin Ellis Franklin  8,905,223  8,905,223  8,416,300  488,923  Specialty  1  4,517  <0.1%  Irwin David Simon  Albert A Manzone  1,262,970  295,737  1,201,545  295,737  1,201,545  214,376  81,361  Total  84  22,580,585  100.0%  Ira J Lamel  190,405  174,434  174,434  Jeffrey Robinson  105,610  69,427  69,427  36,183  !Total of Top 5 Insiders:  10,759,945  10,646,366  10,076,082  606,467  Confidential - Analysis and Assumptions Subject to Change  Jefferies  Jefferies LLC / January 2024  35  Current WORLD Stockholder Overview  Top 35 Shareholders as of Q3 2023  Shareholder Base Analysis  Investor Breakdown  Regional Breakdown  Insiders 26%  TX  4%  Mid-Atlantic 8%  Mid-West 10%  lnt'I 8%  Retail CA  21% 9%  Other 12%  NY  42%  Source: FactSet and Bloomberg. Account holdings are based on 13F filings (as of 9/30/23 or most recent available). Insider holdings based on Proxy and Form 4 filings.  (1) 13D filed on January 3, 2024. 
 

 Benchmarking WORLD Trading Performance  Confidential - Analysis and Assumptions Subject to Change  Stock Price Performance - Since SPAC Closing (June 2020)  60.0%  40.0%  20.0%  0.0%  (20.0%)  (40.0%)  (60.0%)  (80.0%)  Mid-Cap Packaged  (2) Mid-Cap Packaged Focds Index comprised of BRBR, UTZ, SMPL, FLO, THS, HAIN, BGS and POST.  Jefferies  Jefferies LLC / January 2024  38  YTO  LTM  Since June 2020  11.0%  {14.1%)  (62.0%)  (4.1%)  (4.5%)  6.8%  (1.6%)  8.5%  4.4%  (100.0%)  Jun-20  Sep-20 Dec-20 Mar-21 Jun-21 Sep-21  -WORLD  Dec-21 Mar-22 Jun-22 Sep-22 Dec-22 Mar-23 Jun-23 Sep-23 Dec-23 Ingredients -Mid-Cap Packaged Foods  Source: S&P Capital IQ as of January 19, 2024. Note: Indexes are market cap weighted.  (1) Ingredients Index comprised of TATE, INGR and SZU. 


 $5,091  S00-  13%  $3,457  ,,fJ Ylers  6%  Confidential - Analysis and Assumptions Subject to Change  Preliminary Analysis of Selected Public Companies - Financial Benchmarking  Ingredients & Sweeteners  Mid•Cap Packaged foods  ($Millions)  2023E  Revenue  '22E- '23E  Revenue Growth  2023E  Gross Margin  2023E  EBITDA  ,--I ----W-orl-d --··I I----W-o-rld----I·  L_! !!s.:.'!! -J l_ .:'!!!:!!'!n -J  '22E- '23E 2023E  EBITDA Growth EBITDA Margin  $11,122  TATEO(LYLE  25%  TATEO(LYLE  49%  21%  ..,,. l 'f"ers  48%  bellnng  20%  Simply ,.,?._  36%  $1,359  soo-':w  28%  bell11ng  20%  27%  Simply  20%  23%  TATEO(LVLI:  19%  S00-ZUCKER  )  $8,299  $1,263  Tr•eello,...  ®  lngredion  ®  J· l yJers  $7,342  t'>  S00-ZUCKER  ®  lngredion  $1,195  1.utz.  S00-ZUCKER  35%  ...> l YJe·rs  $508  t')  lngredion  19%  ®  hO Fooosc, t111c.  17%  •  34%  TATEO{LYLE  $423  bell11ng  17%  15%  TreelloW!e  TATl:O(LVLI:  $2,266  Simply 2.'.!  5%  bell11ng  32%  Median  $2,053  Median  4%  Median  30%  •  $363  !utz.  9%  $348  Median  7%  14%  ft1...&W!e  lngredion  Median  Median  14%  )  r---------------I  ; World 30%;  bell11ng  I ---------------1  7% ; World 14%;  $2,053  4%  $348  Simply '?.',!  hO FootK, htc.  lngredion  i------------------------------•1  i-------------------·  -  $1,792  lutz  3% ; World 27%;  $317  5%  ; World 14%;  llO ,INC.  llO ,INC.  ---------------'  belh1ng  i---------------1  Simply 2.'.!  l.utz.  $1,712  ; World 2%;  ---------------·  27%  $246  .J- l yvers  1%  13%  -  l.utz.  !utz.  $1,446  ; World  1% ;  22%  $185  ; World  (1 %);  i---------------·  S00-  12%  r------------------------------1' •  11%  .i.------------,---·'  Jefferies  Jefferies LLC / January 2024  39  •  - $148  Simply '?.',!  $1,251  0%  22%  TrcclJousc  T:n.,"t:Hotu.e  ; World (2%);  --------------..1  aaoJooos,1111,.  i---------------1  -  }  i---------------,  ..,.FJRY'ers  ; World $551;  (3%)  Ingredion  21% ; World $78;  TATe&LVLe  (7%)  10%  ----  ·  I-------------------------------I.'  ----------------  .  -  C \,!  I  I  •  ; World $5461  (5%)  18%  : World $781  --------------;J  {18%)  -  8  Source: S&-P C-a-pit-al-IQ-a-s o-f -Ja-nu-ar-y 1-9,-2-02·4.  hO .btC.  Tree&W!e