Exhibit (c)(viii)

 Jefferies LLC  Member SIPC  The information provided in this document, including valuation discussions, represents the views of Jefferies Investment Banking. There is no assurance that the views expressed herein will be consistent with the views expressed by Jefferies Research or its Analysts. Nothing in this document should be understood as a promise or offer of favorable research coverage.  Project WORLD  Special Committee Discussion Materials  November 4, 2023 / Confidential  convert as provided.  please add the tag. [1-14]  add to submission as: EX-99.(c)(viii) Description: Exhibit (c)(viii)  add tag: Exhibit (c)(viii)  Jefferies LLC / November 2023 
 

 Disclaimer  Jefferies LLC / November 2023  2  The following pages contain material provided to the Special Committee (the “Special Committee”) of the Board of Directors (the “Board”) of WORLD (the “Company”) by Jefferies LLC (“Jefferies”) in connection with Project WORLD.  These materials were prepared on a confidential basis in connection with an oral presentation to the Special Committee and not with a view toward complying with the disclosure standards under state or federal securities laws or otherwise. These materials are solely for use of the Special Committee in its evaluation of the proposed transaction and may not be used for any other purpose or disclosed to any party without Jefferies’ prior written consent.  The information contained in this presentation was based solely on publicly available information or information furnished to Jefferies by the Company. Jefferies has relied, without independent investigation or verification, on the accuracy, completeness and fair presentation of all such information and the conclusions contained herein are conditioned upon such information (whether written or oral) being accurate, complete and fairly presented in all respects. None of Jefferies, its affiliates or its or their respective employees, directors, officers, contractors, advisors, members, successors or agents makes any representation or warranty in respect of the accuracy, completeness or fair presentation of any information or any conclusion contained herein. Jefferies, its affiliates and its and their respective employees, directors, officers, contractors, advisors, members, successors and agents shall have no liability with respect to any information or matter contained herein, or any oral information provided herewith or data any of them generates. Jefferies undertakes no obligation to update these materials.  Neither Jefferies nor any of its affiliates is an advisor as to legal, tax, accounting or regulatory matters in any jurisdiction.  This presentation is a preliminary analysis only and does not constitute a fairness opinion of Jefferies as to the value of the Company, and as such, should not be relied upon by the Company or by any other person as such. The financial data, analyses and assumptions reflected here remain subject to refinement and change based on further discussions and information regarding WORLD’s businesses and its financial and operating markets. 
 

 WORLD Trading Performance - Public Market Perspective  Stock Price Performance - Since SPAC Closing (June 2020)  $16.00  ----------  6000  : ROSWELL Estimated:  1Average Cost-Basis of 1  $14.00  I $5.47 I ShareW I  Current: $3.53 Performance: (65.0%) Median: $7.46  5000  Jefferies  Jefferies LLC / November 2023  3  $12.00  June 26, 2023 ROSWELL  Offers $4.00 I  Share to Acquire  WORLD  4000  $10.00  April 18 - May 18, 2022 ROSWELL Begins Purchasing Shares in WORLD  I  I  I I  $8.00  3000  I  I  I  I  I  I  I  I  I  I I  June 21, 2023 ROSWELL  Purchases  488,923 Shares.  130 Filing. Ownership is  -21.08%  $6.00  2000  March 14, 2022 Q4'21 andFull Year Earnings Release  March 13, 2023 ROSWELL  Purchases  1,900,000 Shares. ownership is  -18.33%  I  March 14, 2023  ROSWELL  Purchases 120,000 shares. ownership  is -18.62%  March"15, 2023 ROSWELL  Purchases 580,000  Shares. 130 Filing.  ownership is  -19.99%     $4.00  ma  1000  $2.00  $0.00  Jun-20 Sep-20 Dec-20 Mar-21 Jun-21 Sep-21  Dec-21 Mar-22 Jun-22 Sep-22 Dec-22 Mar-23 Jun-23 Sep-23  -Volume -Price  Source: 130 and Form 4 filings and S&P Capital IQas of November I, 2023.  Note: Represents Sababa Holdings FREE LLC purchases. Ownership percentage calculations include shares held by Sababa Holdings FREE and those held by Marpet, LLC. ROSWELL is the manager of this entity, and the Trust owns 75% of Marpet. See appendix for further detail.  (I) Weighted average price. 
 

 WORLD Trading Performance - Public Market Perspective  Stock Price Performance - Beginning Two Weeks Prior to ROSWELL Offer (June 26, 2023)<11  Price  ,---------------: % R dsfu Roswfiioff;,---------------,  $5.00  Jefferies  Jefferies LLC / November 2023  3  $4.50  $4.00  $3.50  $3.00  $2.50  $2.00  $1.50  $1.00  June 26, 2023  ROSWELL Offers  $4.00 I Share to Acquire WORLO  ( -..-W. h-ile-~-83-% -of ,I  1 Trading Volume at 1  1  or Below $4.00  1  , Q.SytEJ;L_Off.e!:..  -------,  ( -17% of Trading  1  1 Volume Above the 1  1 $4.00 ROSWELL 1  ' - - 9!t!!-:.:.- -  Volume  (000's)  6,000  5,000  -4,000  3,000  2,000  1,000  $0.50  $0.00 ............... . ....... . .........._._._..._..............._._........ ._.........._............_............................. ._.........._........_._........... ._._........ ._....... . .........._..........._..............._._........ ._.......... ......... 0  Jun-23 Jul-23  Aug-23 Sep-23 Oct-23  -Volume -Price  Source: S&P Capital IQ asof November 1, 2023.  (1) Date of 13D public filing. 
 

 $2.90  $4.75  $4.25  $5.00  $4.35  $3.70  $3.50  $5.00  $2.10  $6.15  $8.65  $7.50  $8.80  $7.60  $5.00  $4.70  $8.50  $4.70  $2.00  $4.00  $6.00  $8.00  $10.00  Metrics  Methodology  Illustrative Valuation Benchmarks Presented to the Special Committee on October 16, 2023  Implied Enterprise Value /  For Informational Purposes Only  All Industries (1 day)  Historical Premium Analysis  2023E EBITDA of $79.3M  2024P EBITDA of $94.7M  Source: WORLD latest 10-Q filing (As of June 30, 2023), Management LRP provided by WORLD management.  Note: Share prices are rounded to nearest $0.05. Fully Diluted Share Count includes 42,767,109 common shares, 3,192,834 RSUs, 116,608 RSAs, 2,358,504 PSUs (per 10Q as of 6/30/2023).  Assumes debt balance of $438.6 million and cash balance of $24.1 million as of Q2 end numbers.  Assumes debt balance of $436.7 million and cash balance of $23.8 million as of year end 2023E per Management LRP.  Discounted Cash Flow Analysis  Perpetuity Growth Method  Selected Public Companies Analysis  Selected Transactions Analysis  2023E Adj. EBITDA Multiple  Discount rate of 11.0% - 12.5% and perpetuity growth rate of 2.0% - 3.0%  7.0x – 9.0x 2023E Adj. EBITDA  ─ 2023E Mgmt Adj. EBITDA of $79.3M  7.8x – 9.8x 2023E Adj. EBITDA  ─ 2023E Mgmt Adj. EBITDA of $79.3M  25th and 75th Percentile premiums to unaffected share price ($3.12), 1-day prior to 6/26/23  20% - 25% IRR, 8.0x – 10.0x exit multiple, 5.0x leverage  6.8x – 8.8x 2024P Adj. EBITDA  ─ 2024P Mgmt Adj. EBITDA of $94.7M  6.4x  5.4x  7.7x  6.4x  8.9x  7.4x  10.1x  8.5x  11.3x  9.5x  All Industries (30 days)  25th and 75th Percentile premiums to unaffected share price ($2.86), 30-days prior to 6/26/23  2023E Adj. EBITDA Multiple  (1)  2024P Adj. EBITDA Multiple  (1)  (2)  ROSWELL  Proposal (6/26/23):  $4.00  Unaffected Share Price (6/23/23):  $3.12  Research Target Range  Jefferies LLC / November 2023  6  52-Week Trading Range  Range of price targets of research published after offer from Bidder  52-Week intra-day high and low share prices  (For Reference Only)  Financial Buyer Analysis 
 

 Illustrative Analysis at Various Prices  ($Millions, except price per share data)  Sources: WORLD latest 10-Q filing (As of June 30, 2023) and Management LRP provided by WORLD management.  Includes 42,767,109 common shares, 3,192,834 RSUs, 116,608 RSAs, 2,358,504 PSUs (per 10Q as of 6/30/2023).  VWAP calculated based on calendar days.  Premiums represent those presented to the committee on October 16, 2023. Please reference pages 11 and 12.  Illustrative Analysis at Various Prices  Unaffected 6/23/23  Proposal  Illustrative Stock Price per Share  $3.12  $4.00  $4.25  $4.50  $4.75  $5.00  $5.25  $5.50  $5.75  $6.00  Fully Diluted Shares Outstanding(1)  48.435  48.435  48.435  48.435  48.435  48.435  48.435  48.435  48.435  48.435  Fully Diluted Market Capitalization  $151  $194  $206  $218  $230  $242  $254  $266  $278  $291  Term Loan (as of 6/30/23)  367  367  367  367  367  367  367  367  367  367  Revolving Credit Facility (as of 6/30/23)  72  72  72  72  72  72  72  72  72  72  Less: Cash and Cash Equivalents (as of 6/30/23)  (24)  (24)  (24)  (24)  (24)  (24)  (24)  (24)  (24)  (24)  Implied Enterprise Value  $566  $608  $620  $632  $645  $657  $669  $681  $693  $705  Implied Premiums  Premium to ROSWELL Proposal  $4.00  (22%)  -  6%  13%  19%  25%  31%  38%  44%  50%  Premium to Unaffected (06/23)  $3.12  -  28%  36%  44%  52%  60%  68%  76%  84%  92%  Premium to 20 day VWAP (06/23) (2)  $3.05  2%  31%  40%  48%  56%  64%  72%  81%  89%  97%  Premium to VWAP since ROSWELL Proposal (06/26) (2)  $3.62  (14%)  11%  17%  24%  31%  38%  45%  52%  59%  66%  Premium / (Discount) to 52-Week High  $4.72  (34%)  (15%)  (10%)  (5%)  1%  6%  11%  17%  22%  27%  Management Adjusted EBITDA Multiples  EBITDA  LTM June 2023A  $77  7.4x  7.9x  8.1x  8.3x  8.4x  8.6x  8.7x  8.9x  9.1x  9.2x  FY2023E  $79  7.1x  7.7x  7.8x  8.0x  8.1x  8.3x  8.4x  8.6x  8.7x  8.9x  FY2024E  $95  6.0x  6.4x  6.6x  6.7x  6.8x  6.9x  7.1x  7.2x  7.3x  7.4x  Consensus Adjusted EBITDA Multiples  EBITDA  FY2023E  $77  7.4x  7.9x  8.1x  8.3x  8.4x  8.6x  8.7x  8.9x  9.1x  9.2x  FY2024E  $85  6.7x  7.2x  7.3x  7.5x  7.6x  7.7x  7.9x  8.0x  8.2x  8.3x  Take-Private *Bump* Premium (3)  Unaffected Premium (3)  Median – Top Quartile  3% - 22%  37% - 60%  $4.12  Jefferies LLC / November 2023  6  $4.27  $4.88  $4.99 
 

 Illustrative Theoretical Future Stock Price as Presented to the Special Committee on October 16, 2023  Illustrative Present Value of Theoretical Future Stock Price Summarym  $14  NTM Consensus EBITDA Multiple: 6.9x (Current)  $13.05  Theoretical Future Price  - PV of Theoretical Future Price  $12  $10.75  $10  $8.75  $8  $6.80  •  •  $6  $4.95  •  $6.95  •  $6.30  $6.65  $3.29  $5.65  $4  ..  rt  $4.80  $2  $3.29  Today (10/13/2023)  2023P  2024P  2025P  2026P  2027P  WORLD NTM Adjusted EBITDA  Net Debt  $94.7M  $102.5M  $110.7M  $117.9M  $125.4M  $412.9M  $379.0M  $339.BM  $291.7M  $233.0M  $18  $16  NTM EBITDA Multiple: 7.8x (3 Year Average)  -  Theoretical Future Price  PV of Theoretical Future Price  $15.40  $14  $12.95  $12  $10.80  $10  $8.70  $8  $6  $6.70 •  $7.25  •  $7.80  •  $8.05  •  $8.20  $4  $2  Today {10/13/2023) 2023P  Source: Management LRP provided by WORLD management. WORLD current stock price as of 10/13/2023.  (1) Present value of future stock price discounted at cost of equity of 16.1%.  2024P  2025P  2026P  2027P  Jefferies LLC / November 2023  7  Jefferies 
 

 Jefferies LLC / November 2023  Process Summary to Date  Signed NDA / Received CIM (12)(1)  Contacted  Strategics (15)  Financial Sponsors (47)  *Participating in ROSWELL Group  Still Active (2)  Declined Post NDA (10)  (1)  8 
 

 Project WORLD - Post-NOA Decline Detail  Contact  Decline Reasons  Jefferies LLC I November 2023  Jefferies 
 

 Jefferies LLC / November 2023  Buyer Feedback Prior to Bid Date  Attractions  Considerations  10 
 

 Illustrative Premiums Paid Analysis - Equity Values $ lOOM - $500M as Presented to the Special Committee on October 16, 2023  U.S. and Canada All Cash M&A Majority Transactions, Announced Since January 2018  One-Day & 4-Week Premiums Selected Statisticsm  75%  60%  E 45%  .:E,  .,  ct 30%  60%  64%  37%  40%  19%  22%  15%  0%  25th Percentile  Median  4-Week Premium  75th Percentile  One-Day Premium  One-Day & 4-Week Premiumsm  45%  39.3%  32.2%  30%  >.  .'c-:,':  :,  r:::r  .,  Lt  15%  7.3% 7.3%  0%  <0%  15.8%15.2%  6.8% 5.6%  11.3%9.6%  0-10%  13.6o/°l.2.4%  13.0%  10.7%  10-20%  20-30%  Premium Intervals  30-40%  40-50%  50%+  One-Day Premium 4-Week Premium  Source: Thomson Reuters as of October 6, 2023.  (1} 4-week premium based on closing stock price 4 weeks prior to announcement.  Jefferies LLC / November 2023  11  Jefferies 
 

 Based on price bump of final offer price to initial offer price.  Casper had negative EBITDA at time of transaction.  Initial offer price used represents midpoint of initial offer range provided of $14.00 - $15.00.  Jefferies LLC / November 2023  Consumer Retail US Sponsor-Led Take-Private Transactions Over $200M as Presented to the Special Committee on October 16, 2023 (1)  Source: Thomson SDC, S&P Capital IQ and Company Filings.  Note: * Represents transaction was leaked before announcement. (5)  (1) Includes US sponsor-led leveraged buyouts with transaction values greater than $200 million since 1/1/2013.(6)  Initial offer price used represents midpoint of initial offer range provided of $9.50 - $10.00. Initial offer price used represents midpoint of initial offer range provided of $7.00 - $8.00.  Initial offer price used represents midpoint of initial offer range provided of $37.00 - $40.00.  Initial offer price used represents midpoint of initial offer range provided of $12.00 - $13.00.  Initial offer price used represents midpoint of initial offer range provided of $17.25 - $19.00.  12  Consortium Led by Management Group  21%*  03/17/23  $2,534  0%  32%  (0%)  8.2x  12/12/22  $3,700  29%  24%  15%  100.1x  11/15/21  $330  (15%)  94%  64%  NM(3)  06/19/21  $13,700  25%  61%  59%  12.7x  05/06/21  $4,214  19%  18%  37%  6.6x  03/03/21  $3,222  0% (4)  22%  44%  4.8x  06/24/19  $622  (11%)(5)  19%  15%  18.8x  06/07/19  $670  0%  9%*  28%  4.8x  1%*  0% (6)  2% (7)  5% (8)  10% (9)  Announcement Date  Implied Enterprise Value ($mil)  Price Bump(2)  Premium 1-Day  Premium 1-Mo.  EV / LTM EBITDA  04/17/19  $1,119  27%  13.2x  11/06/18  $736  (8%)  (2%)  11.2x  09/25/18  $2,249  19%  26%  16.0x  02/20/18  $560  25%  15%  10.5x  07/09/17  $2,180  31%  25%  10.7x  06/29/17  $337  27%  34%  31%  7.7x  12/07/15  $13,900  8%  78%  76%  13.2x  Mean:  $3,338  6.1%  32.5%  30.7%  17.0x  Median:  $2,180  1.8%  23.8%  27.2%  11.0x 
 

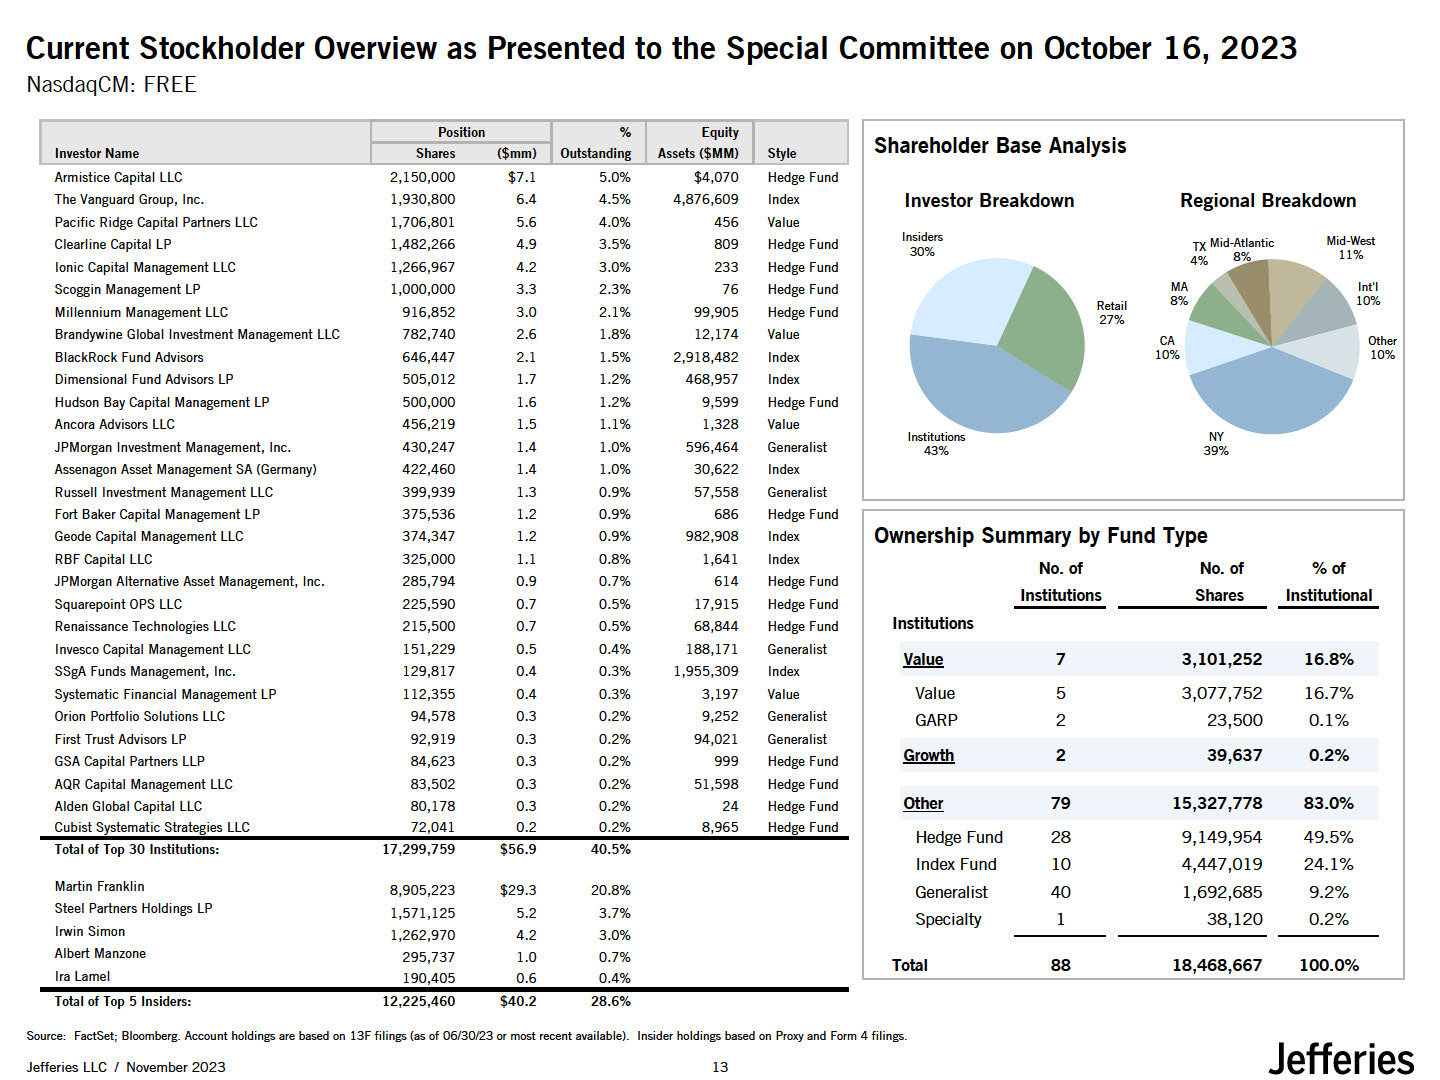
 Investor Name   Position Shares  ($mm)  %  Outstanding  Equity Assets ($MM)  Style  Shareholder Base Analysis  Armistice Capital LLC  2,150,000  $7.1  5.0%  $4,070  Hedge Fund  Investor Breakdown Regional Breakdown  Insiders Mid-West  30% 11%  MA lnt'I  Retail 8% 10%  27%  CA Other  10% 10%  Institutions  43%  The Vanguard Group, Inc.  1,930,800  6.4  4.5%  4,876,609  Index  Pacific Ridge Capital Partners LLC  1,706,801  5.6  4.0%  456  Value  Clearline Capital LP  1,482,266  4.9  3.5%  809  Hedge Fund  Ionic Capital Management LLC  1,266,967  4.2  3.0%  233  Hedge Fund  Scoggin Management LP  1,000,000  3.3  2.3%  76  Hedge Fund  Millennium Management LLC  916,852  3.0  2.1%  99,905  Hedge Fund  Brandywine Global Investment Management LLC  782,740  2.6  1.8%  12,174  Value  BlackRock Fund Advisors  646,447  2.1  1.5%  2,918,482  Index  Dimensional Fund Advisors LP  505,012  1.7  1.2%  468,957  Index  Hudson Bay Capital Management LP  500,000  1.6  1.2%  9,599  Hedge Fund  Ancora Advisors LLC  456,219  1.5  1.1%  1,328  Value  JPMorgan Investment Management, Inc.  430,247  1.4  1.0%  596,464  Generalist  Assenagon Asset Management SA (Germany)  422,460  1.4  1.0%  30,622  Index  Russell Investment Management LLC  399,939  1.3  0.9%  57,558  Generalist  Fort Baker Capital Management LP  375,536  1.2  0.9%  686  Hedge Fund  Ownership Summaryby Fund Type  No. of No. of %of  Institutions Shares Institutional  Geode Capital Management LLC  374,347  1.2  0.9%  982,908  Index  RBF Capital LLC  325,000  1.1  0.8%  1,641  Index  JPMorgan Alternative Asset Management, Inc.  285,794  0.9  0.7%  614  Hedge Fund  Squarepoint OPS LLC  225,590  0.7  0.5%  17,915  Hedge Fund  Renaissance Technologies LLC  215,500  0.7  0.5%  68,844  Hedge Fund  Institutions  Value  Value GARP  Growth  other  Hedge Fund Index Fund Generalist Specialty  Total  7 3,101,252 16.8%  5 3,077,752 16.7%  2 23,500 0.1%  2 39,637 0.2%  79 15,327,778 83.0%  28 9,149,954 49.5%  10 4,447,019 24.1%  40 1,692,685 9.2%   1 38,120 0.2%   88 18,468,667 100.0%  Invesco Capital Management LLC  151,229  0.5  0.4%  188,171  Generalist  SSgA Funds Management, Inc.  129,817  0.4  0.3%  1,955,309  Index  Systematic Financial Management LP  112,355  0.4  0.3%  3,197  Value  Orion Portfolio Solutions LLC  94,578  0.3  0.2%  9,252  Generalist  First Trust Advisors LP  92,919  0.3  0.2%  94,021  Generalist  GSA Capital Partners LLP  84,623  0.3  0.2%  999  Hedge Fund  AQR Capital Management LLC  83,502  0.3  0.2%  51,598  Hedge Fund  Alden Global Capital LLC  80,178  0.3  0.2%  24  Hedge Fund  Cubist Systematic Strategies LLC  72,041  0.2  0.2%  8,965  Hedge Fund  Total of Top 30 Institutions:  17,299,759  $56.9  40.5%  Martin Franklin  8,905,223  $29.3  20.8%  Steel Partners Holdings LP  1,571,125  5.2  3.7%  Irwin Simon  1,262,970  4.2  3.0%  Albert Manzone  295,737  1.0  0.7%  Ira Lamel  190,405  0.6  0.4%  Jefferies  Jefferies LLC / November 2023  14  Current Stockholder Overview as Presented to the Special Committee on October 16, 2023  NasdaqCM: FREE  Total of Top 5 Insiders: 12,225,460 $40.2 28.6%  Source: FactSet; Bloomberg. Account holdings are based on 13F filings(as of 06/30/23 or most recent available). Insider holdings based on Proxy and Form 4 filings. 


 Purchase Date  Purchasing Entity  Number of Shares  Weighted Average Price  Weighted Value  Price Range  4/18/2022 - 5/18/2022  Sababa Holdings FREE  5,766,300  $6.81(1  $39,268,503  Marpet, LLC  50,000  6.81'1  340,500  3/13/2023  Sababa Holdings FREE  1,900,000  2.97  5,643,000  $2.77 to $3.10  3/14/2023  Sababa Holdings FREE  120,000  2.95  354,000  $2.86 to $3.00  3/15/2023  Sababa Holdings FREE  580,000  2.79  1,618,200  $2.67 to $2.87  6/16/2023  Sababa Holdings FREE  488,923  -- -- - - 3...00_  1,466,671  $2.97 to $3.00  Total  8,905,223  $5.47  $48,690,874  Jefferies  Jefferies LLC / November 2023  14  Average Purchase Price per Share Calculation for ROSWELL Affiliated Entities as Presented to the Special Committee on October 16, 2023  1  2  3  4  5  Stock Performance since April 2022  Price per Share  $9.00  1  $8.00  $7.00  $6.00  $5.00  $4.00  $3.00  $2.00  $1.00  Current Price:   $3.29   $0.00 +---.---.-----,----,----,----,,----,.----,---,  Apr-22 Jun-22 Aug-22 Oct-22 Dec-22 Feb-23 Apr-23 Jun-23 Aug-23 Oct-23  -WORLD Stock Price  Description of Affiliated Entities  Entity  Relationship with ROSWELL  Sababa Holdings FREE LLC  Sababa Holdings FREE owns 8,855,223 shares of WORLD  ROSWELL is the manager of this entity  Marpet, LLC  Source: 13D Filings, Bloomberg. WORLD stock price data as of 10/1312023.  (1) Represents VWAP of WORLD stock for period beginning 4/1/2022 and ending 6130/2022, per Bloomberg. Does not represent VWAP of individual purchases of securities.  Marpet owns 50,000 shares of WORLD  ROSWELL is the manager of this entity and his Trust owns 75% of Marpet