Exhibit (c)(vi)
Preliminary Draft - Confidential - Analysis and Assumptions Subject to
Change Project WORLD Special Committee Discussion Materials October 2023 / Confidential Jefferies LLC Member SIPC The informatiol"I provided in this document including valuation discussions, represents the views of Jefferies Investment
Banking There is no assurance that the views expressed herem will beconsistent with the views expressed by Jefferies Research or its Analysts Nothing in this document should be understood as a promise or offer of favorable research
coverage Jefferies
Jefferies Jefferies LLC / October 2023 2 Table of Contents Preliminary Draft -
Confidential - Analysis and Assumptions Subject to Change Situation Overview Public Market Benchmarks Preliminary Review of Strategic Options Preliminary Financial Analyses Appendix 4 6 14 18 30
Jefferies Jefferies LLC / October 2023 2 Disclaimer Preliminary Draft -
Confidential - Analysis and Assumptions Subject to Change The following pages contain material provided to the Special Committee (the "Special Committee") of the Board of Directors (the "Board") of WORLD (the "Company") by Jefferies LLC
("Jefferies") in connection with Project WORLD. These materials were prepared on a confidential basis in connection with an oral presentation to the Special Committee and not with a view toward complying with the disclosure standards under
state or federal securities laws or otherwise. These materials are solely for use of the Special Committee in its evaluation of the proposed transaction and may not be used for any other purpose or disclosed to any party without Jefferies'
prior written consent. The information contained in this presentation was based solely on publicly available information or information furnished to Jefferies by the Company. Jefferies has relied, without independent investigation or
verification, on the accuracy, completeness and fair presentation of all such information and the conclusions contained herein are conditioned upon such information (whether written or oral) being accurate, complete and fairly presented in all
respects. None of Jefferies, its affiIiates or its or their respective employees, directors, officers, contractors, advisors, members, successors or agents makes any representation or warranty in respect of the accuracy, completeness or fair
presentation of any information or any conclusion contained herein. Jefferies, its affiliates and its and their respective employees, directors, officers, contractors, advisors, members, successors and agents shall have no liability with
respect to any information or matter contained herein, or any oral information provided herewith or data any of them generates. Jefferies undertakes no obligation to update these materials. Neither Jefferies nor any of its affiliates is an
advisor as to legal, tax, accounting or regulatory matters in any jurisdiction. This presentation is a preliminary analysis only and does not constitute a fairness opinion of Jefferies as to the value of the Company, and as such, should not be
relied upon by the Company or by any other person as such. The financial data, analyses and assumptions reflected here remain subject to refinement and change based on further discussions and information regarding WORLD's businesses and its
financial and operating markets.
Preliminary Draft - Confidential - Analysis and Assumptions Subject to
Change Jefferies Jefferies LLC / October 2023 2 Situation Overview
Executive Summary Preliminary Draft - Confidential - Analysis and Assumptions
Subject to Change On June 2l5t, 2023, ROSWELL filed an amended 130 jointly with affiliated entities ("Bidder") updating its beneficial ownership to 21.08%Cll in WORLD Subsequently on June 25th, 2023, ROSWELL delivered a non-binding proposal
(the "Proposal") to the Board of Directors (the "Board") of WORLD, pursuant to which Bidder proposed to enter into a transaction to acquire WORLD and combine it with Royal Oak Enterprises, LLC ("Royal Oak") for cash consideration of $4.00 per
share The Proposal implied a 28.2% premium to WORLD's unaffected stock price of $3.12 on June 23rd, 2023, 44.9% premium to WORLD's 3-month VWAP price of $2.76 and 7.9x WORLD's LTM June 2023A Adjusted EBITDA Since then, Jefferies has engaged
in numerous discussions with the Bidder and its advisor, and has had preliminary discussions with approximately 60 additional parties regarding a potential transaction with WORLD 11 parties (including the Bidder) signed an NOA, received a CIM
and were offered access to a preliminary data room on September 19th, 2023 On October 9th, 2023, 7 remaining parties (not including the Bidder) were sent a process letter requesting an initial indication of interest by October 23rd,
2023 Jefferies has reviewed the Company's publicly available information and internal financial projections including its long-range plan ("Management LRP") that was finalized as of September 19th, 2023 At the Special Committee's direction,
based on the work done to date, the materials included here reflect the following analysis and discussion topics: Public market perspectives Preliminary financial analyses of the Company's stand-alone intrinsic value, based on the Management
LRP and an analysis of other publicly traded companies and precedent M&A transactions Supplementary analyses such as an illustrative financial buyer analysis and an M&A Premiums analysis (1) Reflects an ownership ol 8,905,223 shares
of WORLD and calculated based on a total basic share count ol 42,245,974 as of May 9, 2023. Jefferies LLC / October 2023 5 Jefferies
Preliminary Draft - Confidential - Analysis and Assumptions Subject to
Change PubIic Market Benchmarks Jefferies LLC / October 2023 6 Jefferies
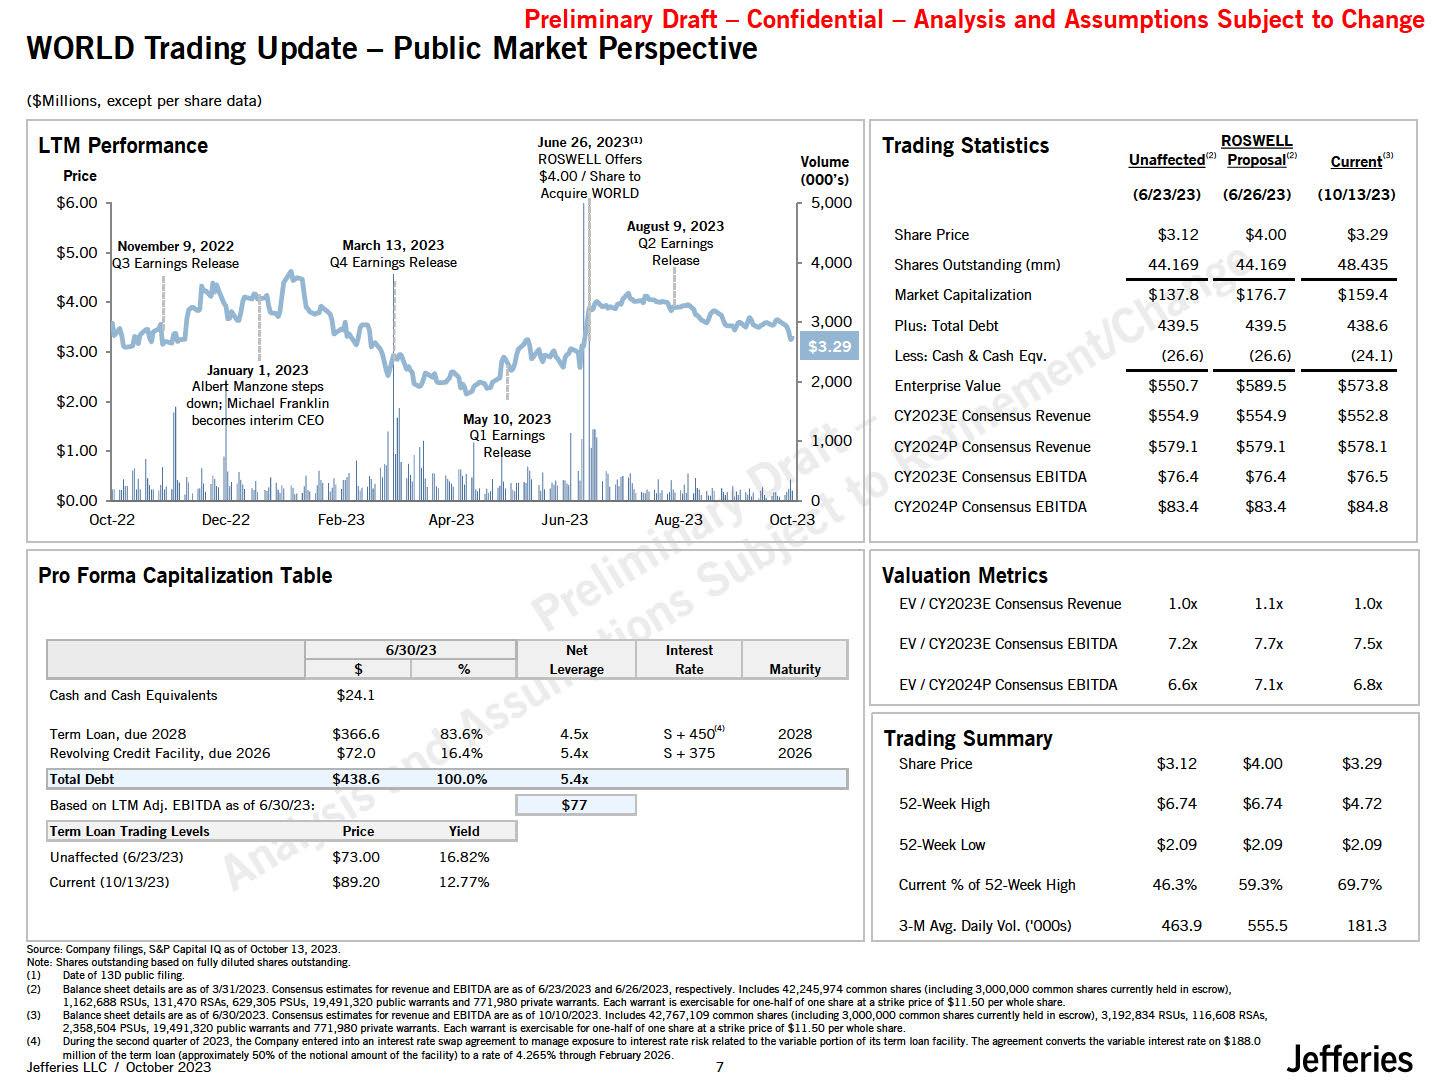
LTM Performance June 26, 202311> ROSWELL Offers Volume Price $4.00 I Share to
(000's) $6.00 Acquire WORLD 5,000 August 9, 2023 $5.00 November 9, 2022 March 13, 2023 Q2 Earnings 3 Earnings Release Q4 Earnings Release Release 4,000 $4.00 i I i I I m3,00a0 I I $3.00 I I January 1, 2023 Albe1 Manzone steps
2,000 $2.00 down; Michael Franklin becomes interim CEO $1.00 1,000 $0.QQ
_.l_.,..........,.._..-"-'-"'-""-'"'-"'-"'-"....._.UU.""-"'UIIU"-"L""-"11"""""'""'"""'"""'...,_.IUIIULllUijl.....,,'-"'-.....,."-'-"''""'-'"'-""--UIIIUIIIUIII."""'"""'-"......._ 0 Oct-22 Dec-22 Feb-23 Apr-23 Jun-23 Aug-23 Oct-23 Trading
Statistics ROSWELL Unaffected'2l Proposa1<2> Current"> (6/23/23) (6/26/23) (10/13/23) Share Price $3.12 $4.00 $3.29 Shares Outstanding (mm) 44.169 44.169 48.435 Market Capitalization $137.8 $176.7 $159.4 PlUS: Total
Debt 439.5 439.5 438.6 Less: Cash & Cash Eqv. (26.6) (26.6) (24.1) Enterprise Value $550.7 $589.5 $573.8 CY2023E Consensus Revenue $554.9 $554.9 $552.8 CY2024P Consensus Revenue $579.1 $579.1 $578.1 CY2023E Consensus
EBITDA $76.4 $76.4 $76.5 CY2024P Consensus EBITDA $83.4 $83.4 $84.8 Pro Forma Capitalization Table 6/30/23 Net Interest $ % Leverage Rate Maturity Cash and Cash Equivalents $24.1 Term loan, due2028 $366.6 83.6% 4.5x S + 450<•>
2028 Revolving Credit Facility, due 2026 $72.0 16.4% 5.4x S + 375 2026 !Total Debt $438.6 100.0% 5.4x Based on LTM Adj. EBITDA as of 6/30/23: $77 ITerm loan Trading levels Price Yield Unaffected (6/23/23) $73.00 16.82% Current (10/13/23)
$89.20 12.77% Valuation Metrics EV/ CY2023EConsensus Revenue EV/ CY2023EConsensus EBITDA EV/ CY2024P Consensus EBITDA 1.0x 1.lx 1.0x 7.2x 7.7x 7.5x 6.6x 7.lx 6.8x Trading Summary Share Price $3.12 $4.00 $3.29 52-Week
High $6.74 $6.74 $4.72 52-Week Low $2.09 $2.09 $2.09 Current% of 52-Week High 46.3% 59.3% 69.7% 3-M Avg. Daily Vol. ('OOOs) 463.9 555.5 181.3 WORLD Trading Update ($Millions, except per share data) Preliminary Draft -
Confidential - Analysis and Assumptions Subject to Change PubIic Market Perspective Source, Company filings, S&Pcapital IQas of October 13, 2023. Note: Sharesoutstanding basedon fully diluted shares outstanding. (I) (2) (4) Dateof 130
public filing. Balance sheet details are as of 3131/2023. Consensusestimates for revenue and EBITOA areas of 6123/2023 and6126/2023, respectively. Includes 42,245,974 common shares (including 3,000,000 common shares currently held in
escrow), 1,162,688 RSUs, 131,470 RSAs, 629,305 PSUs, 19,491,320 public warrants and771,980 private warrants. Each warrant is exercisable for one-half of oneshare at a strike price of $11.50 per whole share. (3) Balance sheet details are as of
6130/2023. Consensusestimates for revenue and EBITOAare asof 10/10/2023. Includes 42,767,109 common shares (including 3,000,000 commonsharescurrently held in escrow), 3,192,834 RSUs, 116,608 RSAs, 2,358,504 PSUs, 19,491,320 public warrants and
771,980 private warrants. Each warrant is exercisable for one-half of one share at a strike price of $11.50 per wtiole share. During the second quarter of 2023, the Company entered into an interest rate swap agreement to manage exposure to
interest raterisk related to the variable portion of its term loan facility. The agreement converts the variable interest rate on $188.0 million of the term loan (approximately 50% of the notional amount of the facility) to a rate of 4.265%
through February 2026. Jefferies LLC / October 2023 Jeffer 1•es 7
Preliminarv Draft - Confidential - Analvsis and Assumotions Subiect to
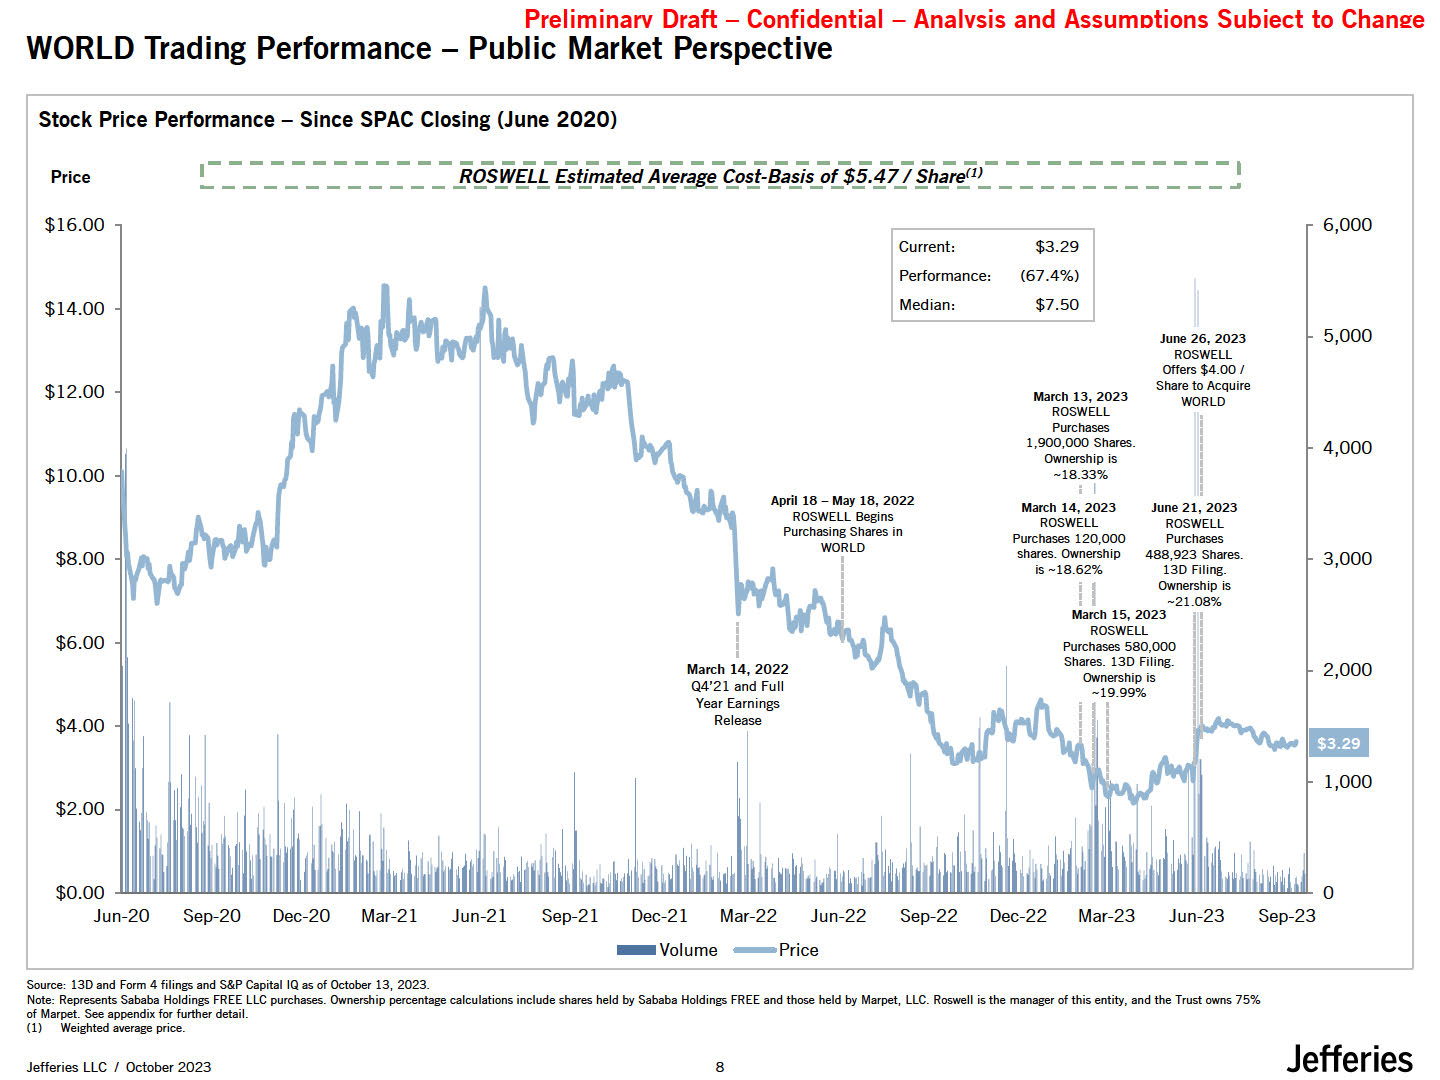
Chane:e WORLD Trading Performance - Public Market Perspective Jefferies Jefferies LLC / October 2023 10 Stock Price Performance - Since SPAC Closing (June 2020) Price ,_ -_ -_ -_ -_ -_-_-_-_-_-_-_-R-O-SW-E-LL-E-sti-m-ate-d
-Av-er-ye-C-os-t-B-as-is-of-$-5.4-7-I S-h-are-<1-J -----------,.. $16.00 $14.00 $12.00 $10.00 $8.00 $6.00 $4.00 $2.00 6,000 $0.00 Jun-20 March 14, 2022 Q4'21 and Full Year Earnings Release Current: $3.29 Performance: {67.4%)
Median: $7.50 April 18 - May 18, 2022 ROSWELL Begins Purchasing Shares in WORLD June 26, 2023 ROSWELL Offers $4.00 I Share to AcQuire WORLD March 13, 2023 ROSWELL Purchases 1,900,000 Shares. ownership is -18.33% i I March 14, 2023
ROSWELL Purchases 120,000 shares. ownership is -18.62% iI June 21, 2023 ROSWELL Purchases 488,923 Shares. 130 Filing. ownership is I -21.08% March 15, 2023 l ROSWELL Purchases 580,000 Shares. 130 Filing. ownership
is -19.99% 5,000 4,000 3,000 2,000 1,000 Sep-20 Dec-20 Mar-21 Jun-21 Sep-21 Dec-21 Mar-22 Jun-22 Sep-22 Dec-22 Mar-23 Jun-23 Sep-23 -Volume -Price Source: 130 and Form 4 filings and S&P Capital IQas of October 13, 2023. Note:
Represents Sababa Holdings FREE LLC purchases. Ownership percentage calculations include shares held by Sababa Holdings FREE and those held by Marpet, LLC. Roswell is the manager of this entity, and the Trust owns 75% of Marpet. See appendix
for further detail. (1) Weighted average price.
Preliminary Draft - Confidential - Analysis and Assumptions Subject to
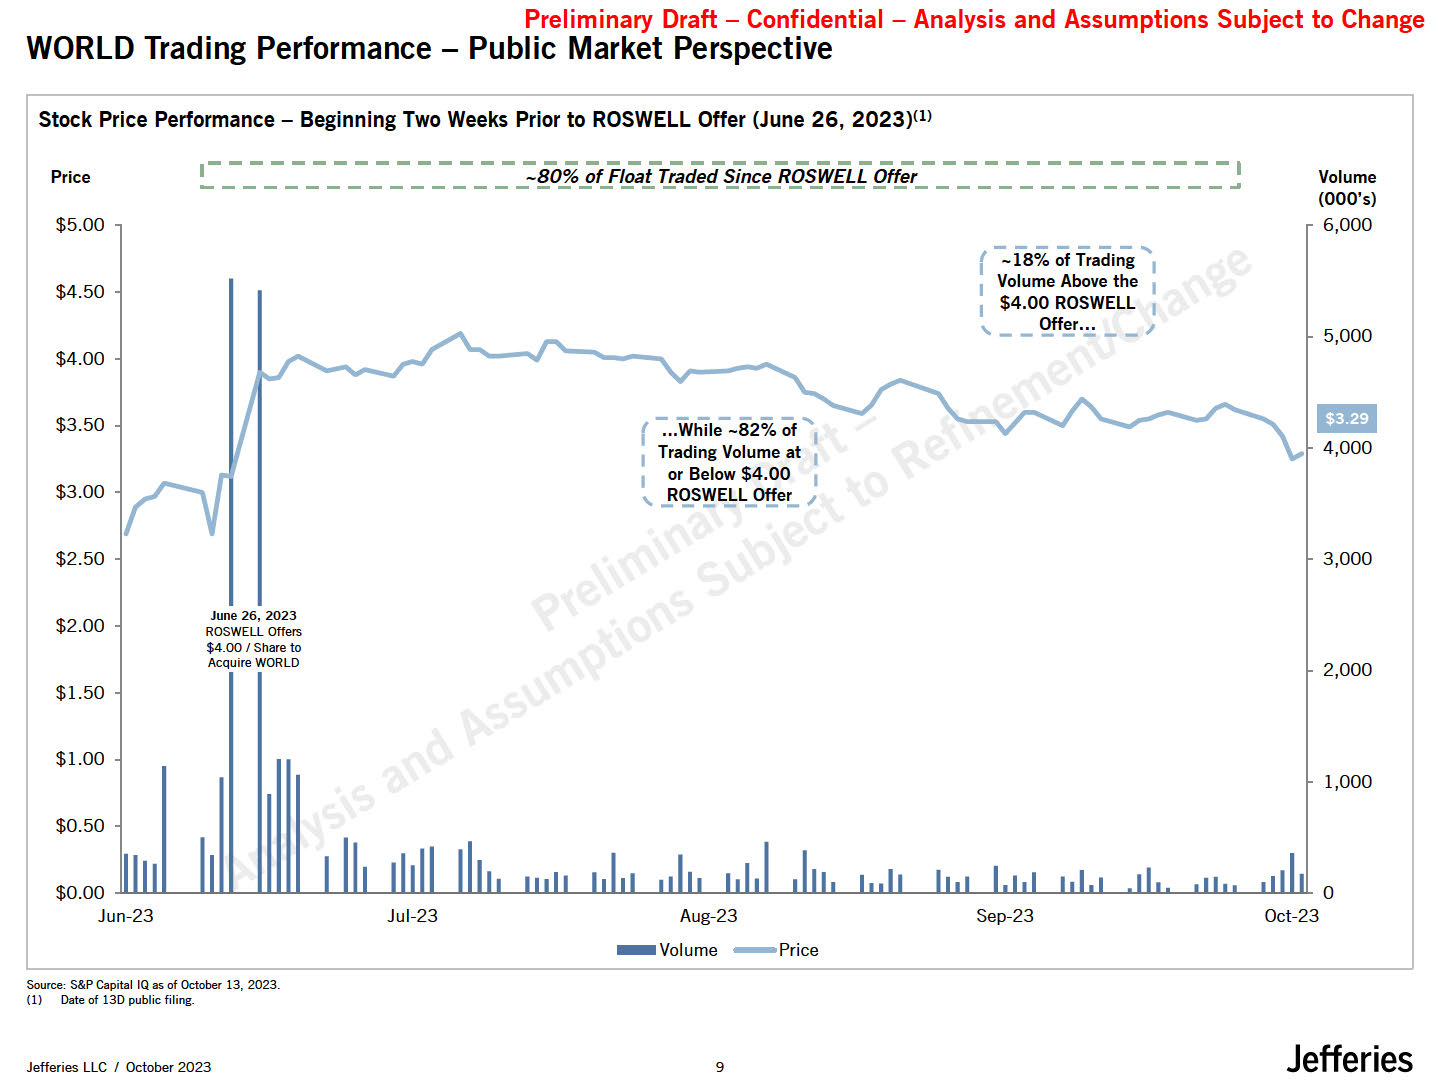
Change WORLD Trading Performance - Public Market Perspective Stock Price Performance - Beginning Two Weeks Prior to ROSWELL Offer (June 26, 2023)<11 Price ,---------------: % R dsfu
Roswfiioff;,---------------, $5.00 Jefferies Jefferies LLC / October 2023 10 $4.50 $4.00 $3.50 $3.00 $2.50 $2.00 $1.50 $1.00 $0.50 June 26, 2023 ROSWELL Offers $4.00 I Share to Acquire WORLD ( -..-.Wh-ile-~-82-% -of , 1
Trading Volume at 1 1 or Below $4.00 , _BQ.S E,!L_O!fe!:.. -------, ( -18% of Trading 1 1 Volume Above the 1 1 $4.00 ROSWELL ' - - 9!f!!-:.:.- Volume (000's) 6,000 5,000 Em 4,000 3,000 2,000 1,000 Jun-23 Jul-23 Sep-23 $0•
00 ............._._............ ._........... .._...LL.--LLLL...._........LLL ..L&JL.L......IUL......_.. ,LLL....._-LII......._. ......_...LL.--LLLL...._--L,LLL--".L&JL.L......IUL.LLl'--JLLL.LL--LII......._. .LLI.....,_
0 Oct-23 Aug-23 -Volume -Price Source: S&P Capital IQ as of October 13, 2023. (1) Date of 13D public filing.
Preliminary Draft - Confidential - Analysis and Assumptions Subject to
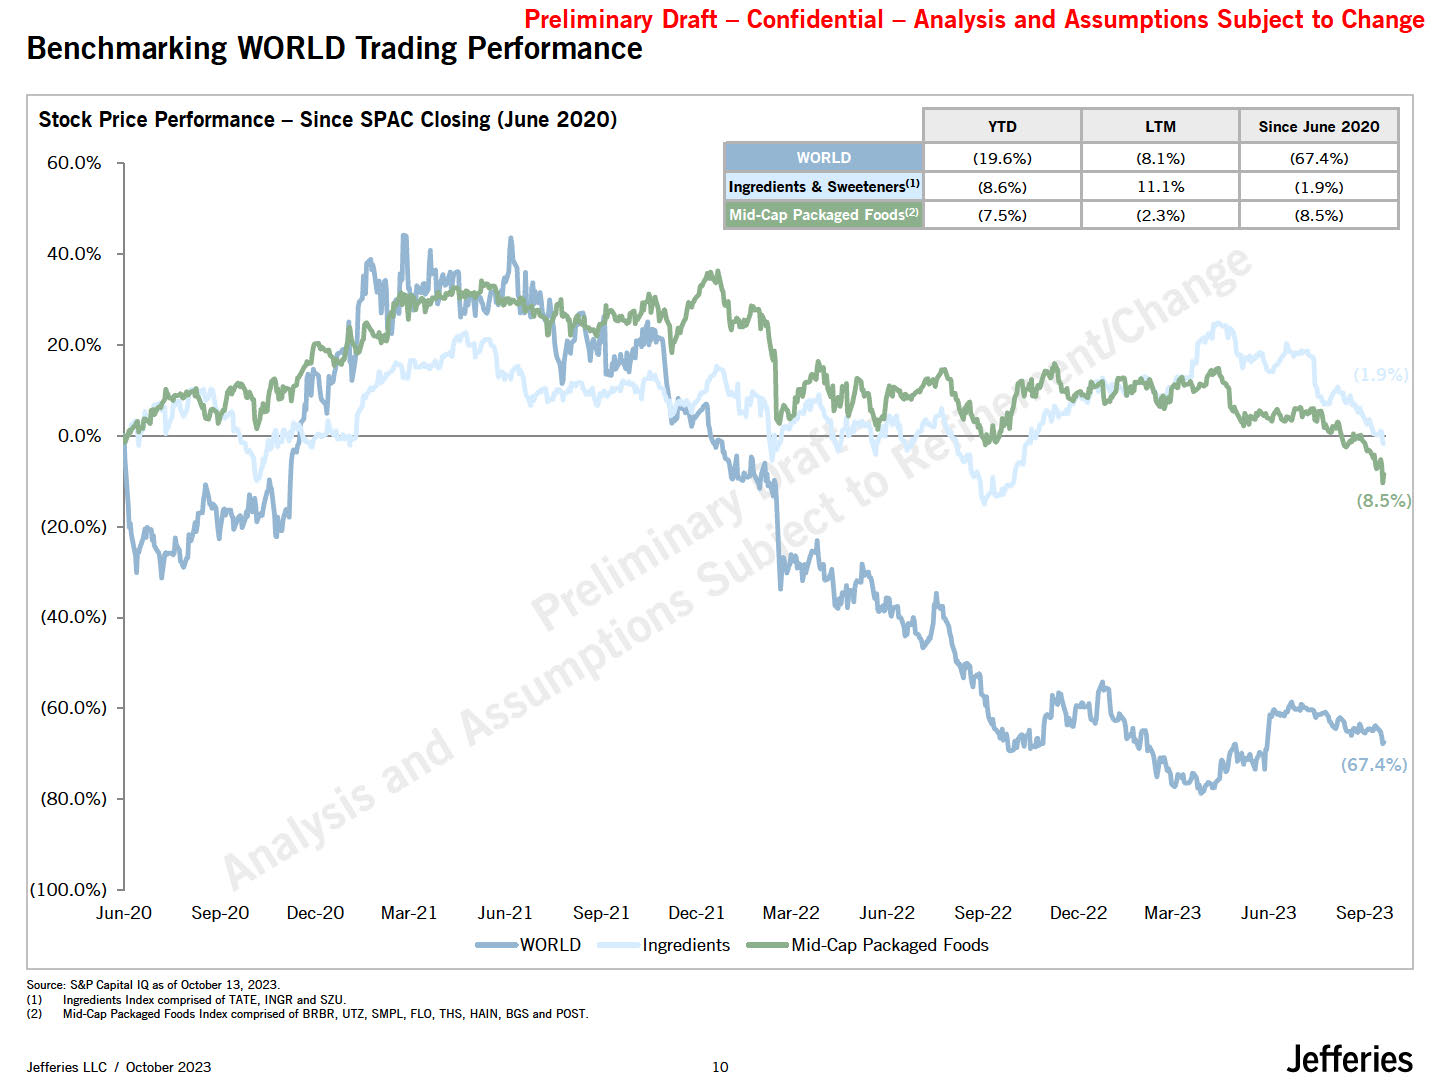
Change Benchmarking WORLD Trading Performance Stock Price Performance - Since SPAC Closing (June 2020) 60.0% 40.0% 20.0% 0.0% (20.0%) (40.0%) (60.0%) (80.0%) Mid-Cap Packaged Jefferies Jefferies LLC / October
2023 10 YTO LTM Since June 2020 (19.6%) (8.1%) (67.4%) (8.6%) 11.1% (1.9%) (7.5%) (2.3%) (8.5%) (100.0%) Jun-20 Sep-20 Dec-20 Mar-21 Jun-21 Sep-21 -WORLD Dec-21 Mar-22 Jun-22 Sep-22 Ingredients -Mid-Cap Packaged
Foods Dec-22 Mar-23 Jun-23 Sep-23 Source: S&P Capital IQ as of October 13, 2023. Ingredients Index comprised of TATE, INGR and SZU. Mid-Cap Packaged Focds Index comprised of BRBR, UTZ, SMPL, FLO, THS, HAIN, BGS and POST.
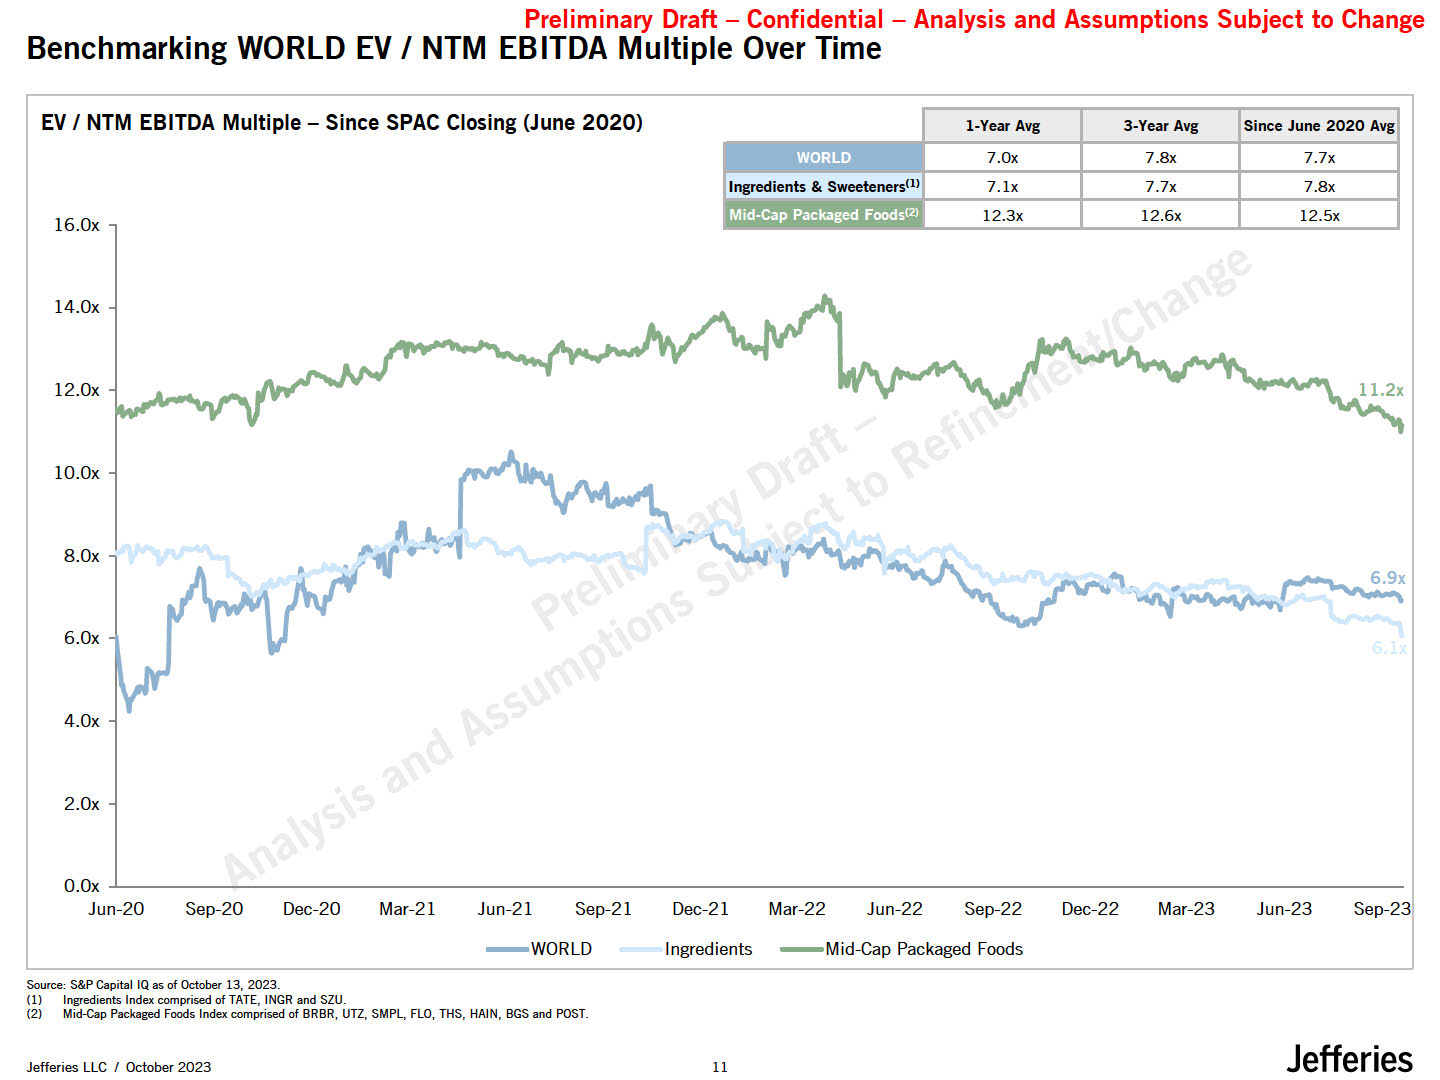
Preliminary Draft - Confidential - Benchmarking WORLD EV/ NTM EBITDA Multiple
Over Time Analysis and Assumptions Subject to Change EV/ NTM EBITDA Multiple - Since SPAC Closing (June 2020) 16.0x 14.0x 12.0x IO.Ox 8.0x 6.0x 4.0x 2.0x O.Ox .... Mid-Cap
Packaged Jun-20 Sep-20 Dec-20 Mar-21 Jun-21 Sep-21 Dec-21 Mar-22 Jun-22 Sep-22 Dec-22 Mar-23 Jun-23 Sep-23 -WORLD Ingredients -Mid-Cap Packaged Foods Source: S&P Capital IQ as of October 13, 2023. (1) Ingredients Index
comprised of TATE, INGR and SZU. (2) Mid-Cap Packaged Foods Index comprised of BRBR, UTZ, SMPL, FLO, THS, HAIN, BGS and POST. Jefferies Jefferies LLC / October 2023 11 1-Year Avg 3-Year Avg Since June 2020
Avg 7.0x 7.8x 7.7x 7.lx 7.7 7.8 12.3x 12.6x 12.Sx
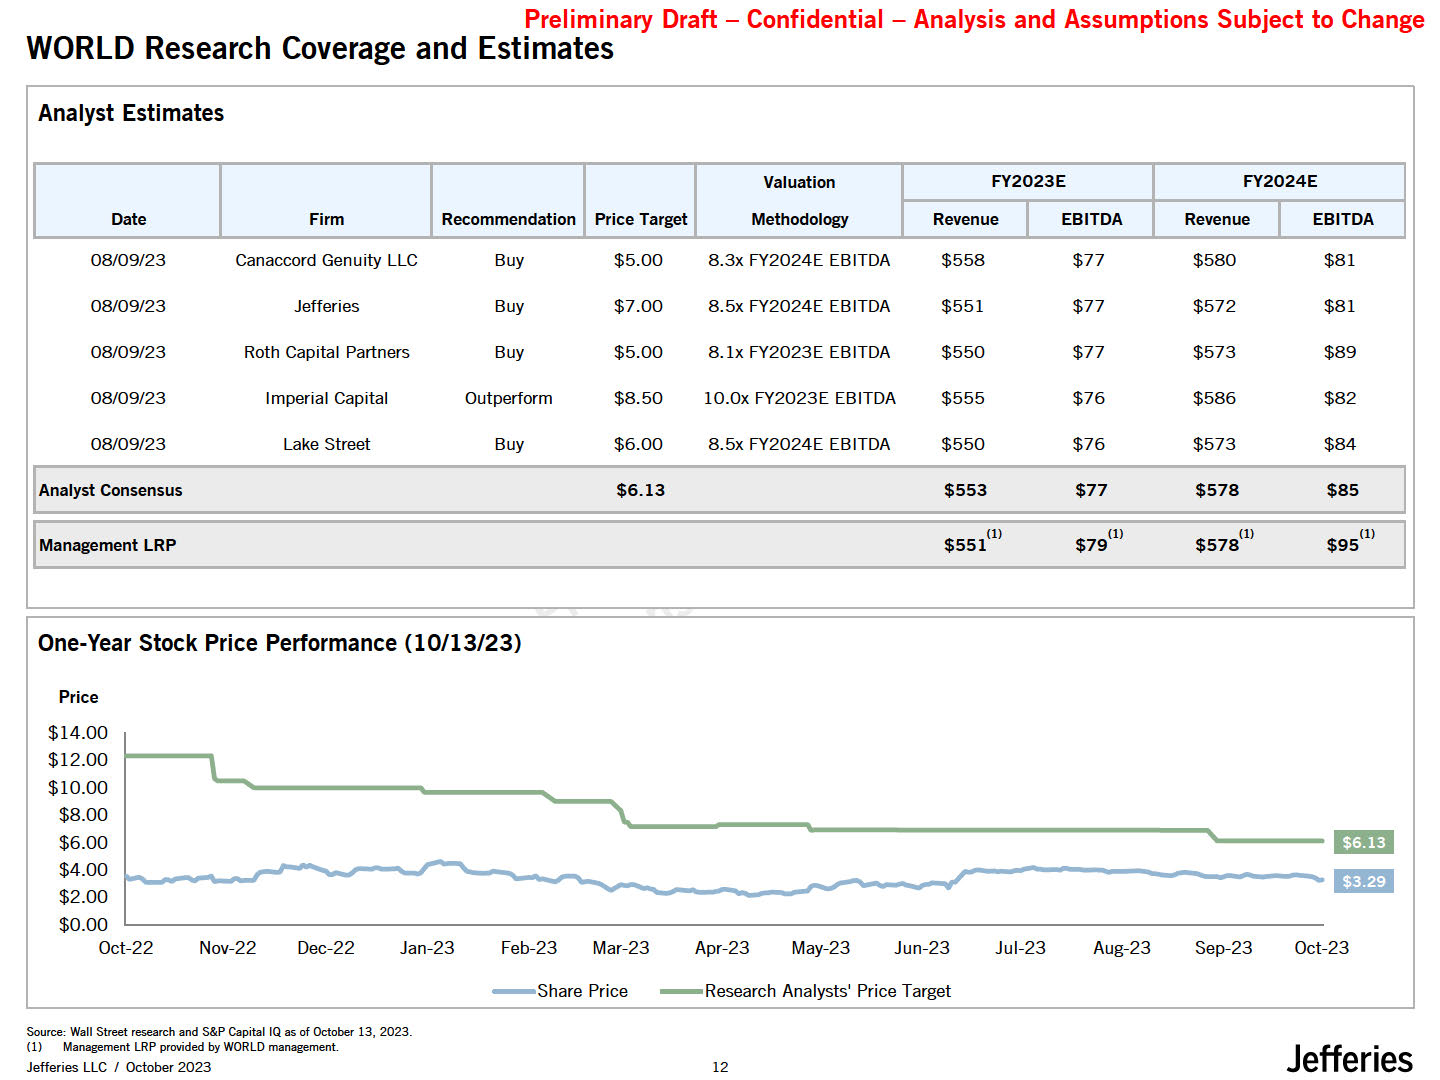
Analyst Estimates Date Firm Recommendation Price
Target Valuation Methodology FY2023E FY2024E Revenue I EBITDA Revenue I EBITDA 08/09/23 Canaccord Genuity LLC Buy $5.00 8.3x FY2024E EBITDA $558 $77 $580 $81 08/09/23 Jefferies Buy $7.00 8.5x FY2024E
EBITDA $551 $77 $572 $81 08/09/23 Roth Capital Partners Buy $5.00 8.lx FY2023E EBITDA $550 $77 $573 $89 08/09/23 Imperial Capital Outperform $8.50 10.0x FY2023E EBITDA $555 $76 $586 $82 08/09/23 Lake
Street Buy $6.00 8.5x FY2024E EBITDA $550 $76 $573 $84 Analyst Consensus $6.13 $553 $77 $578 $85 Management LRP $551(1) $79(1) $578(l) $95(1) One-Year Stock Price Performance (10/13/23) Price $14.00 $12.00 L $10.00 $8.00
'-. $6.00 -- - - $4.00 -- - -- - - -- -.I $2.00 $0.00 Oct-22 Nov-22 Dec-22 Jan-23 Feb-23 Mar-23 Apr-23 May-23 Jun-23 Jul-23 Aug-23 Sep-23 -Share Price -Research Analysts' Price Target Em -nm Oct-23 Preliminary Draft - Confidential -
Analysis and Assumptions Subject to Change WORLD Research Coverage and Estimates Source: Wall Street research and S&P Capital IQ as of October 13, 2023. (1) Management LRP provided by WORLD management. Jefferies LLC / October
2023 12 Jefferies
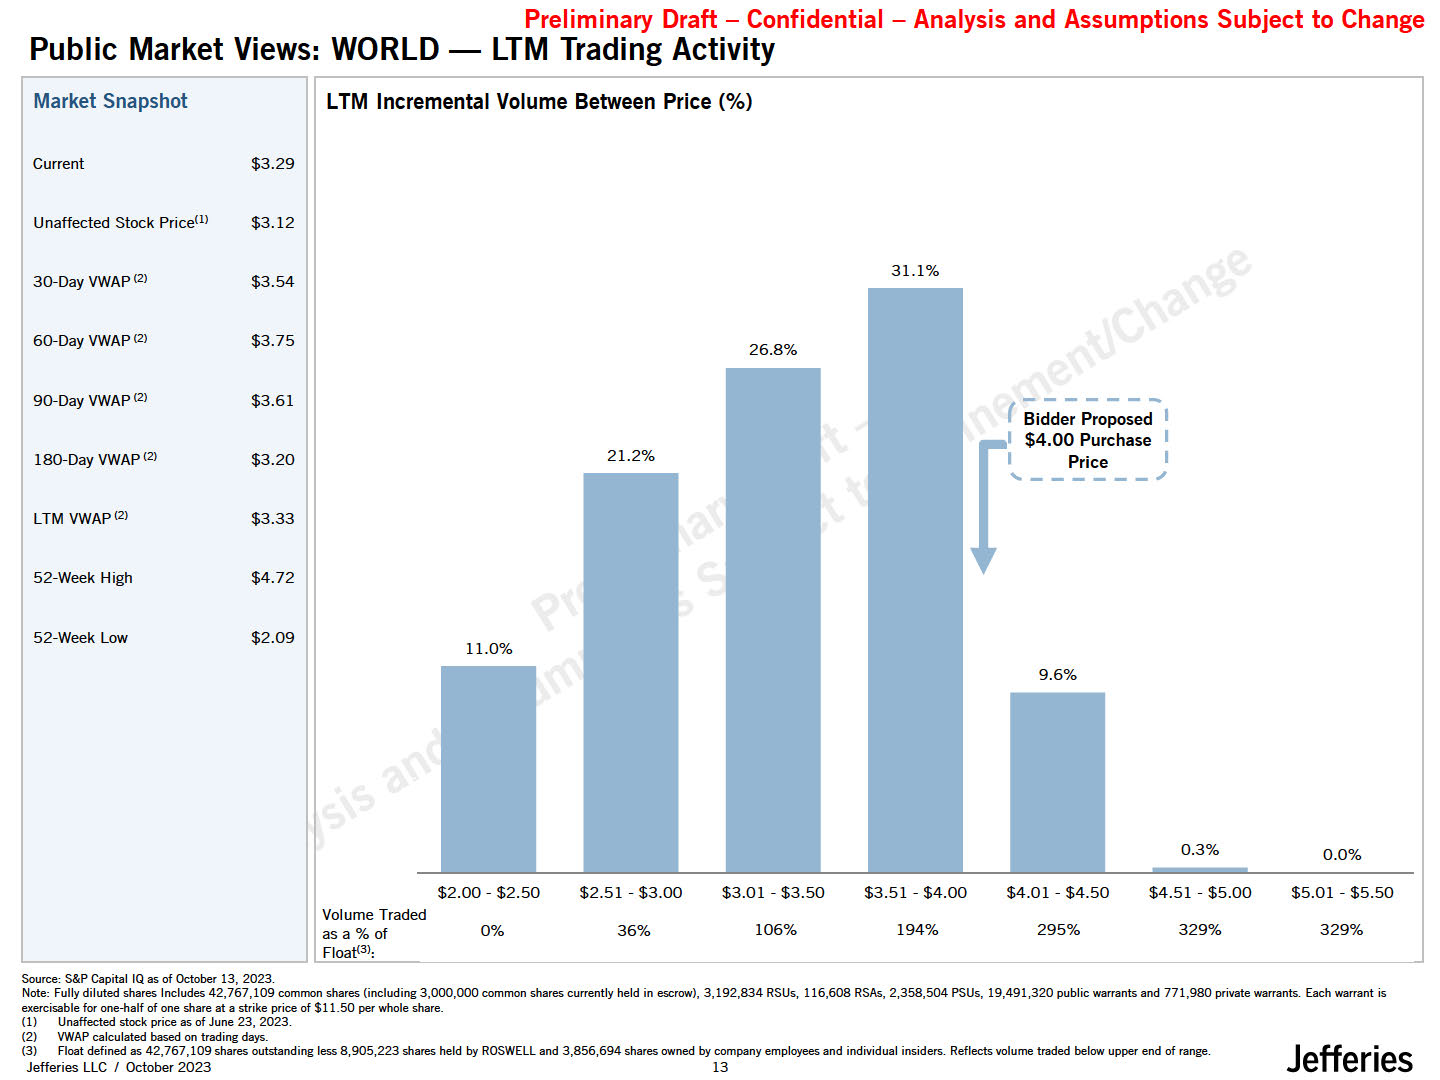
Market Snapshot LTM Incremental Volume Between Price
(%) Current $3.29 Unaffected Stock Pricem $3.12 30-Day VWAP!2l $3.54 31.1% 60-Day VWAP!2l $3.75 26.8% 90-Day VWAP!2l $3.61 ( ;i;e:;o;o d- I I $4.00 Purchase I 180-Day VWAP!2l $3.20 21.2% I"--P-rice---1 LTM
VWAPl2l $3.33 52-Week High $4.72 52-Week Low $2.09 9.6% 0.3% 0.0% $2.00 - $2.50 $2.51 - $3.00 $3.01 - $3.50 $3.51 - $4.00 $4.01 - $4.50 $4.51 - $5.00 $5.01 - $5.50 Volume Traded as a% of 0% 36% 106% 194% 295%
329% 329% Float<3>: Preliminary Draft - Confidential - Analysis and Assumptions Subject to Change LTM Trading Activity Public Market Views: WORLD - Source: S&P Capital IQ asof October 13, 2023. Note: Fully diluted shares
Includes 42,767,109 common shares (including 3,000,000 common shares currently held in escrow), 3,192,834 RSUs, 116,608 RSAs, 2,358,504 PSUs, 19,491,320 public warrants and 771,980 private warrants. Each warrant is exercisable for one-half of
one share at a strike price of $11.50 per whole share. Unaffected stock price asof June 23, 2023. VWAP calculated based on trading days. (3) Float defined as 42,767,109 shares outstanding less 8,905,223 shares held by ROSWELL and 3,856,694
shares owned by company employees and individual insiders. Reflects volume traded below upper end of range. Jefferies LLC / October 2023 13 Jefferies
Preliminary Draft - Confidential - Analysis and Assumptions Subject to
Change Jefferies Jefferies LLC / October 2023 16 Preliminary Review of Strategic Options
Preliminary Draft - Confidential - Analysis and Assumptions Subject to
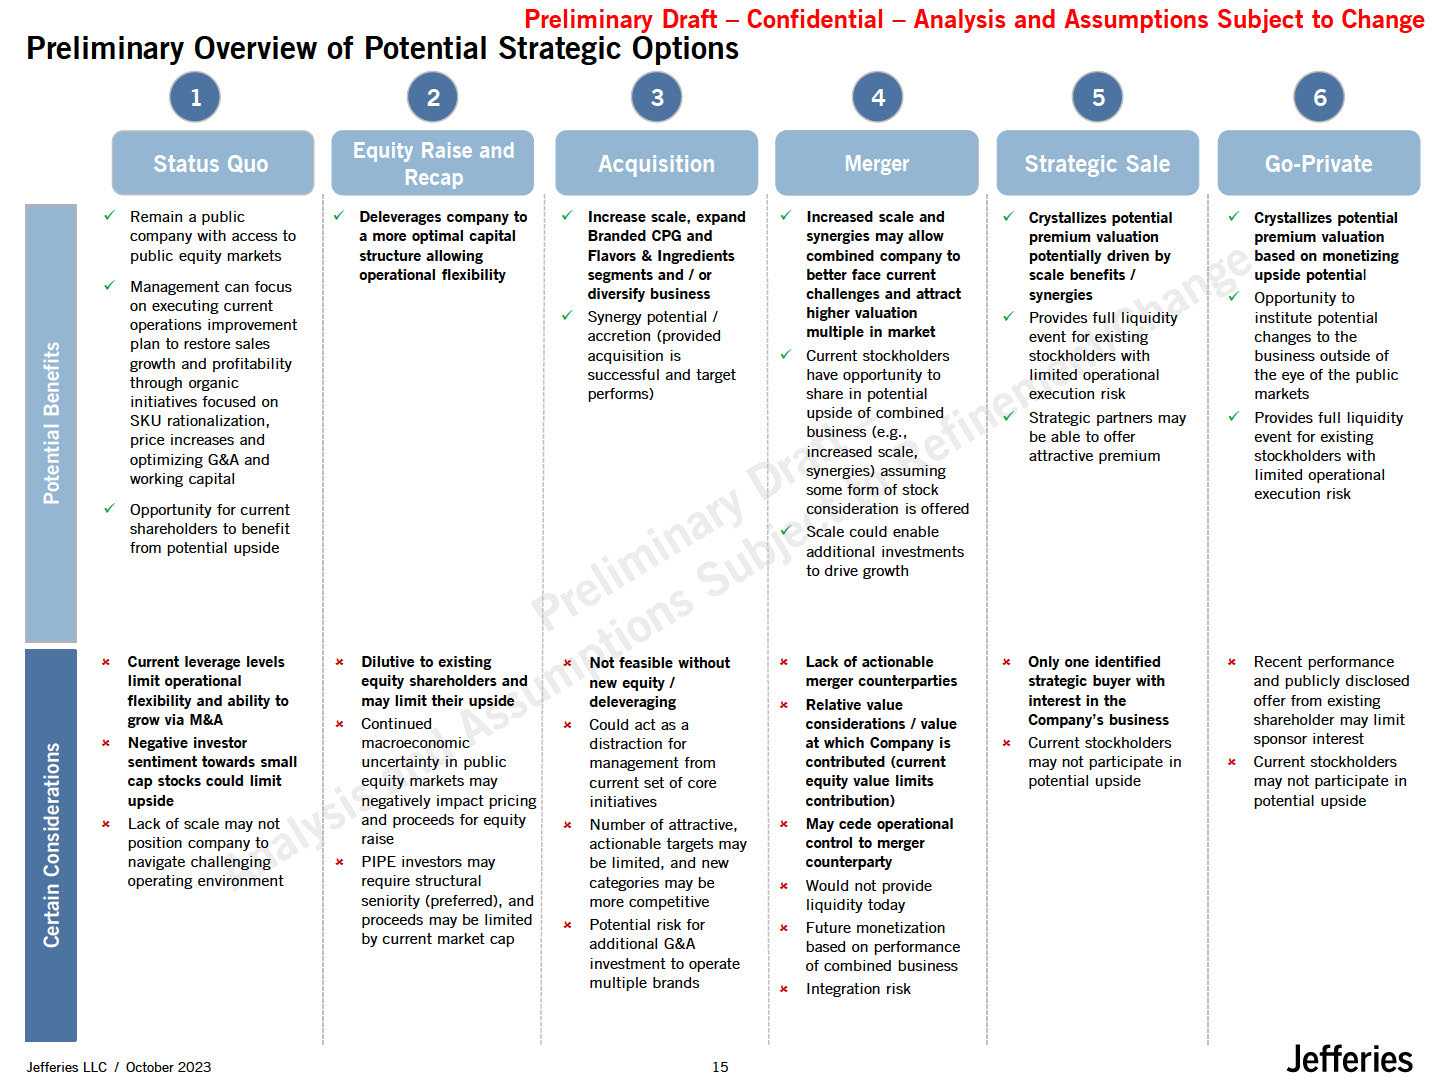
Change Jefferies Jefferies LLC / October 2023 16 Preliminary Overview of Potential Strategic Options • • • • 0 proceeds may be limited by current market cap Remain a public Deleverages company to Increase scale, expand Increased
scale and Crystallizes potential Crystallizes potential company with access to a more optimal capital Branded CPG and synergies may allow premium valuation premium valuation public equity markets structure allowing Flavors &
Ingredients combined company to potentially driven by based on monetizing operational flexibility segments and / or diversify business Synergy potential / accretion (provided better face current challenges and attract higher valuation
multiple in market scale benefits / synergies Provides full liquidity event for existing upside potential Opportunity to institute potential changes to the Management can focus on executing current operations improvement plan to restore
sales growth and profitability through organic initiatives focused on SKU rationalization, price increases and optimizing G&A and working capital Opportunity for current shareholders to benefit from potential upside acquisition
is Current stockholders stockholders with business outside of successful and target have opportunity to limited operational the eye of the public performs) share in potential execution risk markets upside of combined business
(e.g., Strategic partners may be able to offer Provides full liquidity event for existing ' increased scale, synergies) assuming some form of stock consideration is offered attractive premium stockholders with Iimited operational
execution risk Scale could enable additional investments to drive growth x Potential risk for additional G&A investment to operate multiple brands " Current leverage levels x Dilutive to existing x Not feasible without x lack of
actionable x Only one identified x Recent performance limit operational equity shareholders and new equity/ merger counterparties strategic buyer with and publicly disclosed flexibility and ability to may limit their
upside deleveraging : x Relative value interest in the offer from existing grow via M&A " Continued x Could act as a considerations / value Company's business shareholder may limit x Negative investor sentiment towards
small macroeconomic uncertainty in public distraction for management from at which Company is contributed (current x Current stockholders may not participate in " sponsor interest Current stockholders cap stocks could limit equity
markets may current set of core equity value limits potential upside may not participate in " upside lack of scale may not position company to navigate challenging x negatively impact pricing and proceeds for equity raise PIPE
investors may x initiatives Number of attractive, actionable targets may be limited, and new x contribution) May cede operational control to merger counterparty potential upside operating environment require structural seniority
(preferred), and categories may be more competitive x Would not provide liquidity today x Future monetization based on performance of combined business " Integration risk
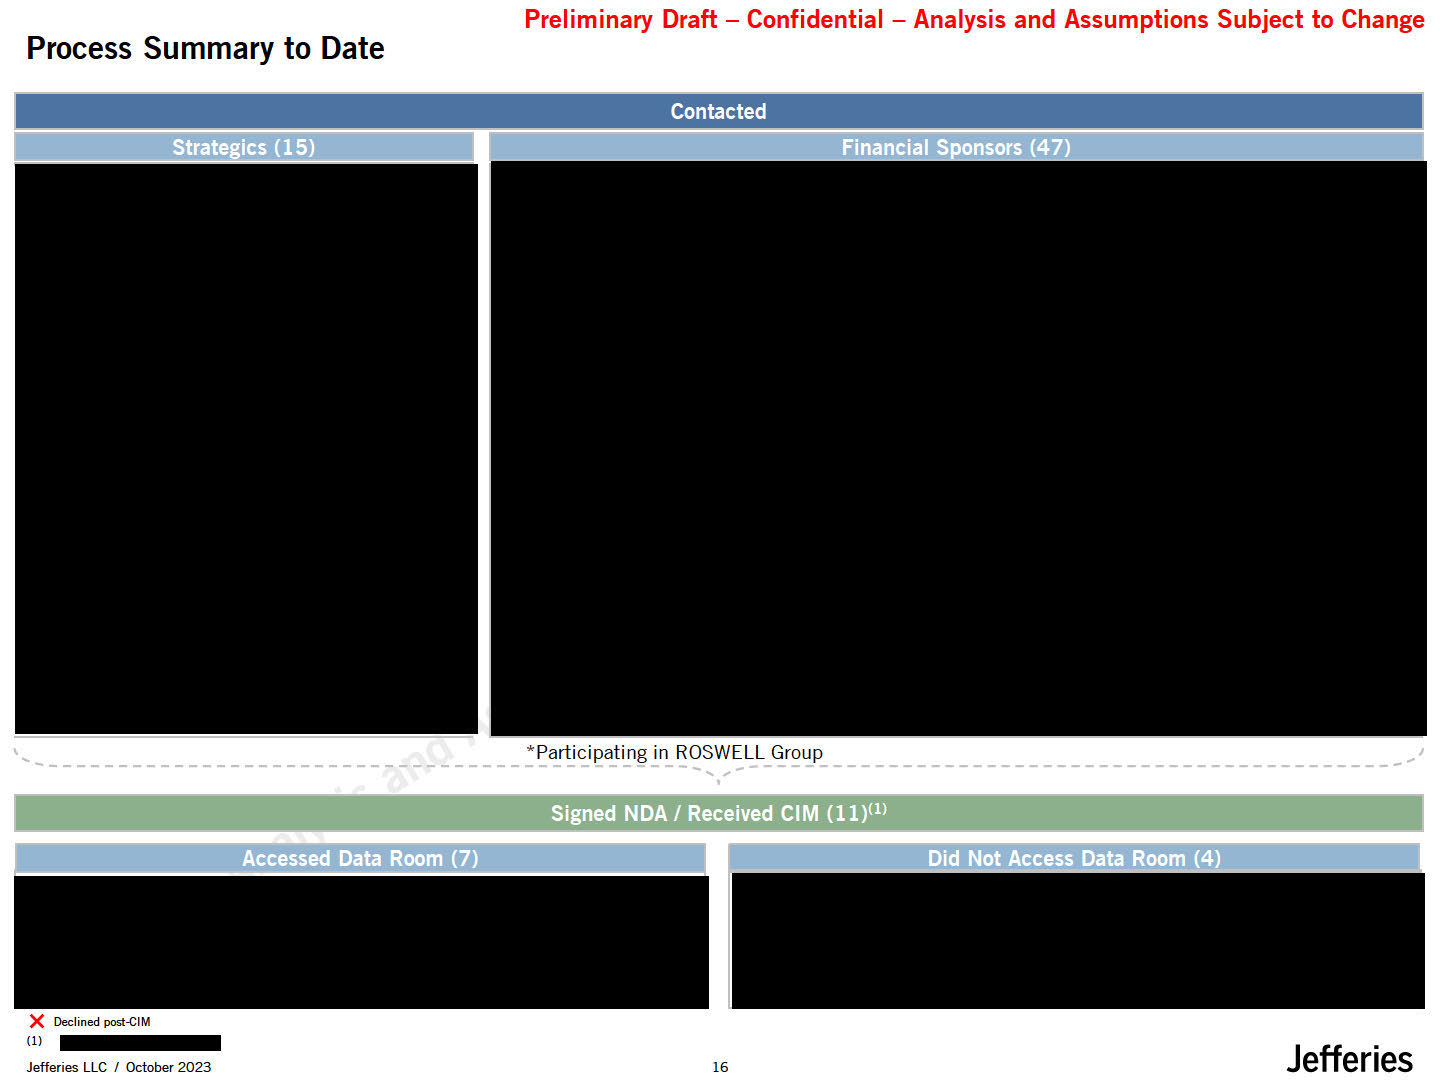
Process Summary to Date Preliminary Draft - Confidential - Analysis and
Assumptions Subject to Change [ Contacted Strate ics (15) *Participating in ROSWELL Group ,,, Signed NOA/ Received CIM (1 l)m Jefferies Jefferies LLC / October 2023 16 X Declined post-CIM (1)
Buyer Feedback to Date Preliminary Draft - Confidential - Analysis and
Assumptions Subject lo Change Attractions Considerations Jefferies LLC I October 2023 Jefferies
Preliminary Draft - Confidential - Analysis and Assumptions Subject to
Change Preliminary Financial Analyses Jefferies LLC / October 2023 18 Jefferies
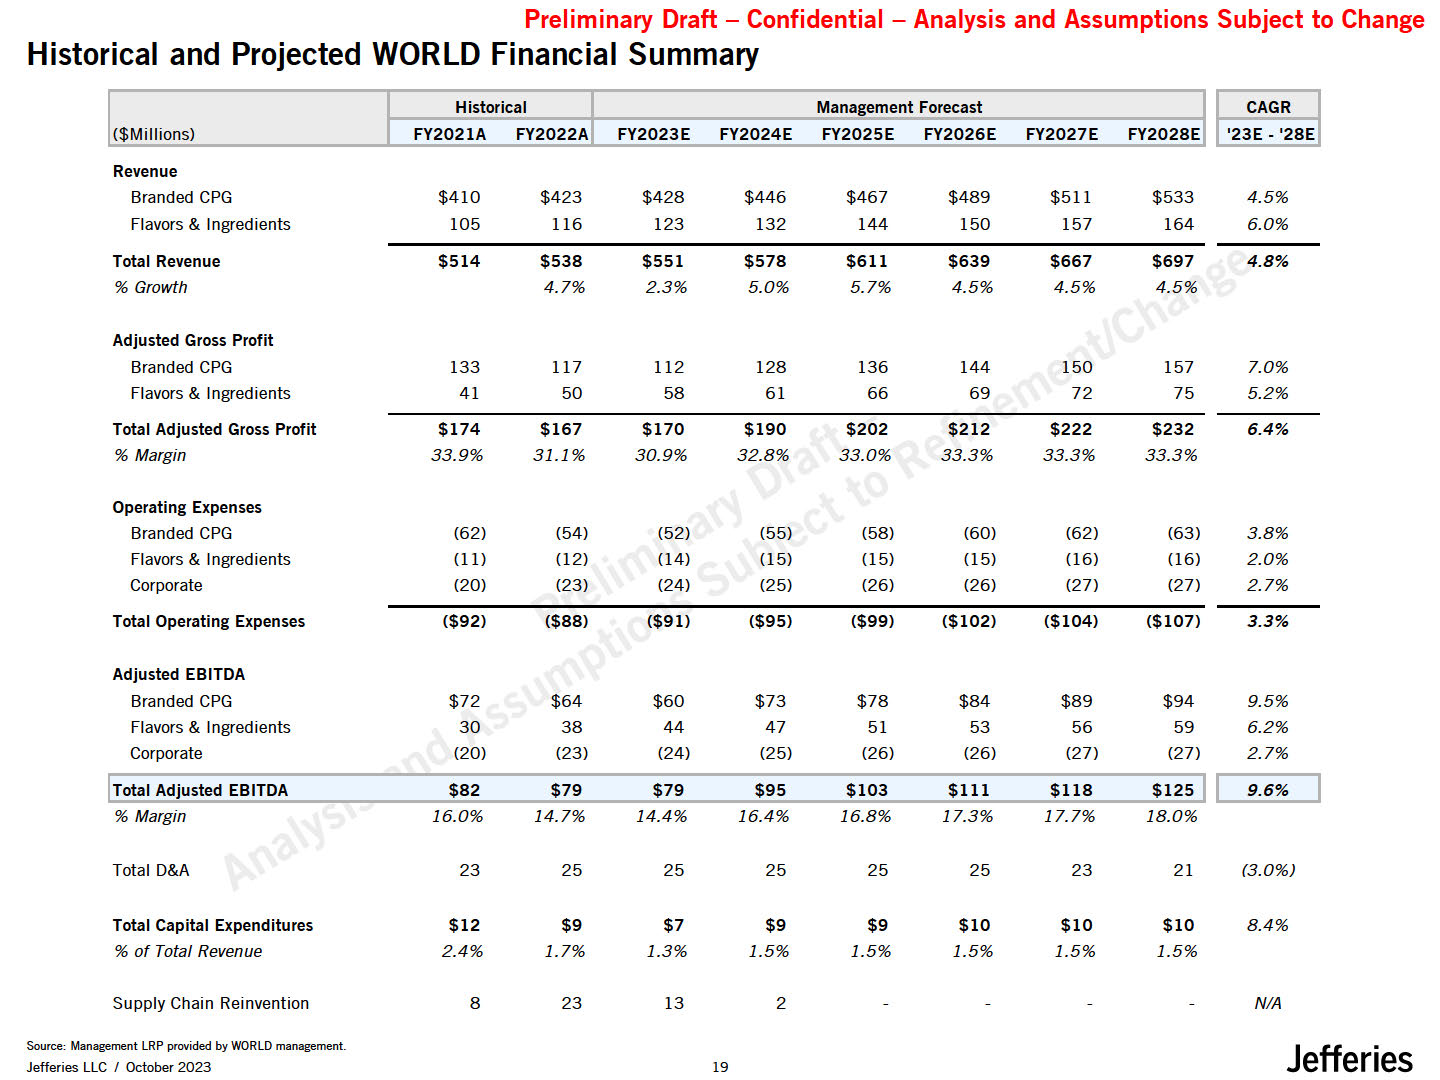
Branded CPG $410 $423 $428 $446 $467 $489 $511 $533 4.5% Flavors &
Ingredients 105 116 123 132 144 150 157 164 6.0% Total Revenue $514 $538 $551 $578 $611 $639 $667 $697 4.8% % Growth 4.7% 2.3% 5.0% 5.7% 4.5% 4.5% 4.5% Adjusted Gross Profit Branded
CPG 133 117 112 128 136 144 150 157 7.0% Flavors & Ingredients 41 50 58 61 66 69 72 75 5.2% Total Adjusted Gross Profit $174 $167 $170 $190 $202 $212 $222 $232 6.4% %
Margin 33.9% 31.1% 30.9% 32.8% 33.0% 33.3% 33.3% 33.3% Operating Expenses Branded CPG (62) (54) (52) (55) (58) (60) (62) (63) 3.8% Flavors &
Ingredients (11) (12) (14) (15) (15) (15) (16) (16) 2.0% Corporate (20) (23) (24) (25) (26) (26) (27) (27) 2.7% Total Operating Expenses ($92) ($88) ($91) ($95) ($99) ($102) ($104) ($107) 3.3% Adjusted
EBITDA Branded CPG $72 $64 $60 $73 $78 $84 $89 $94 9.5% Flavors & Ingredients 30 38 44 47 51 53 56 59 6.2% Corporate (20) (23) (24) (25) (26) (26) (27) (27) 2.7% ($Millions) Historical Management
Forecast FY2021A FY2022A FY2023E FY2024E FY2025E FY2026E FY2027E FY2028E !Total Adjusted EBITDA $82 $79 $79 $95 $103 $111 $118 $12511 9.6% % Margin 16.0% 14.7% 14.4% 16.4% 16.8% 17.3% 17.7% 18.0% Total D&A
23 25 25 25 25 25 23 21 (3.0%) Total Capital Expenditures $12 $9 $7 $9 $9 $10 $10 $10 8.4% % of Total Revenue 2.4% 1.7% 1.3% 1.5% 1.5% 1.5% 1.5% 1.5% Supply Chain Reinvention 8 23 13 2 NIA Preliminary Draft -
Confidential - Analysis and Assumptions Subject to Change Historical and Projected WORLD Financial Summary Revenue CAGR '23E - '28E Source: Management LRP provided by WORLD management. Jefferies LLC / October 2023 19 Jefferies
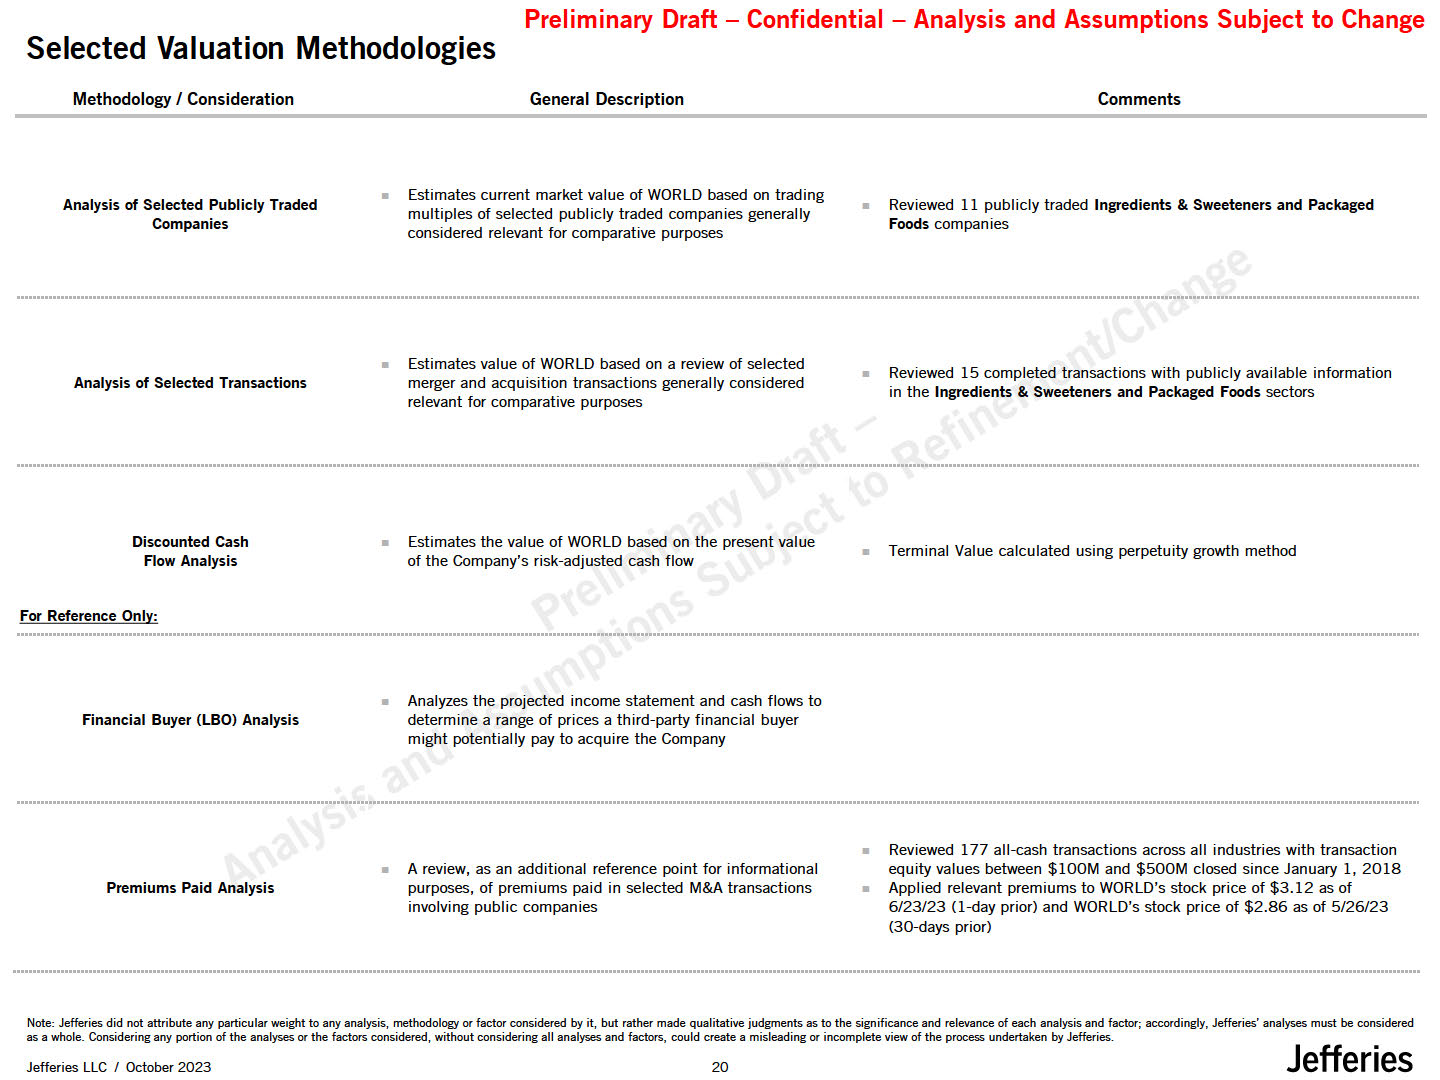
Selected Valuation Methodologies Jefferies Jefferies LLC / October
2023 21 Preliminary Draft - Confidential - Analysis and Assumptions Subject to Change Methodology / Consideration General Description Comments Analysis of Selected Publicly Traded Companies Estimates current market value of WORLD based
on trading multiples of selected publicly traded companies generally considered relevant for comparative purposes Analysis of Selected Transactions Estimates value of WORLD based on a review of selected merger and acquisition transactions
generally considered relevant for comparative purposes Discounted Cash Flow Analysis Estimates the value of WORLD based on the present value of the Company's risk-adjusted cash flow For Reference Only: Financial Buyer (LBO) Analysis
Analyzes the projected income statement and cash flows to determine a range of prices a third-party financial buyer might potentially pay to acquire the Company Premiums Paid Analysis A review, as an additional reference point for
informational purposes, of premiums paid in selected M&A transactions involving public companies Reviewed 11 publicly traded Ingredients & Sweeteners and Packaged Foods companies Reviewed 15 completed transactions with publicly
available information in the Ingredients & Sweeteners and Packaged Foods sectors Terminal Value calculated using perpetuity growth method Reviewed 177 all-cash transactions across all industries with transaction equity values between
$100M and $500M closed since January 1, 2018 Applied relevant premiums to WORLD's stock price of $3.12 as of 6/23/23 (1-day prior) and WORLD's stock price of $2.86 as of 5/26/23 (30-days prior) Note: Jefferies did not attribute any
particular weight to any analysis, methodology Of factor considered by it, but rather made qualitative judgments as to the significance and relevance of each analysis and factor; accordingly, Jefferies' analyses must be considered as a whole.
Considering any portion of the analyses or the factors considered, without considering all analyses and factors, could create a misleading or incomplete view of the process undertaken by Jefferies.
Preliminary Draft - Confidential - Analysis and Assumptions Subject to
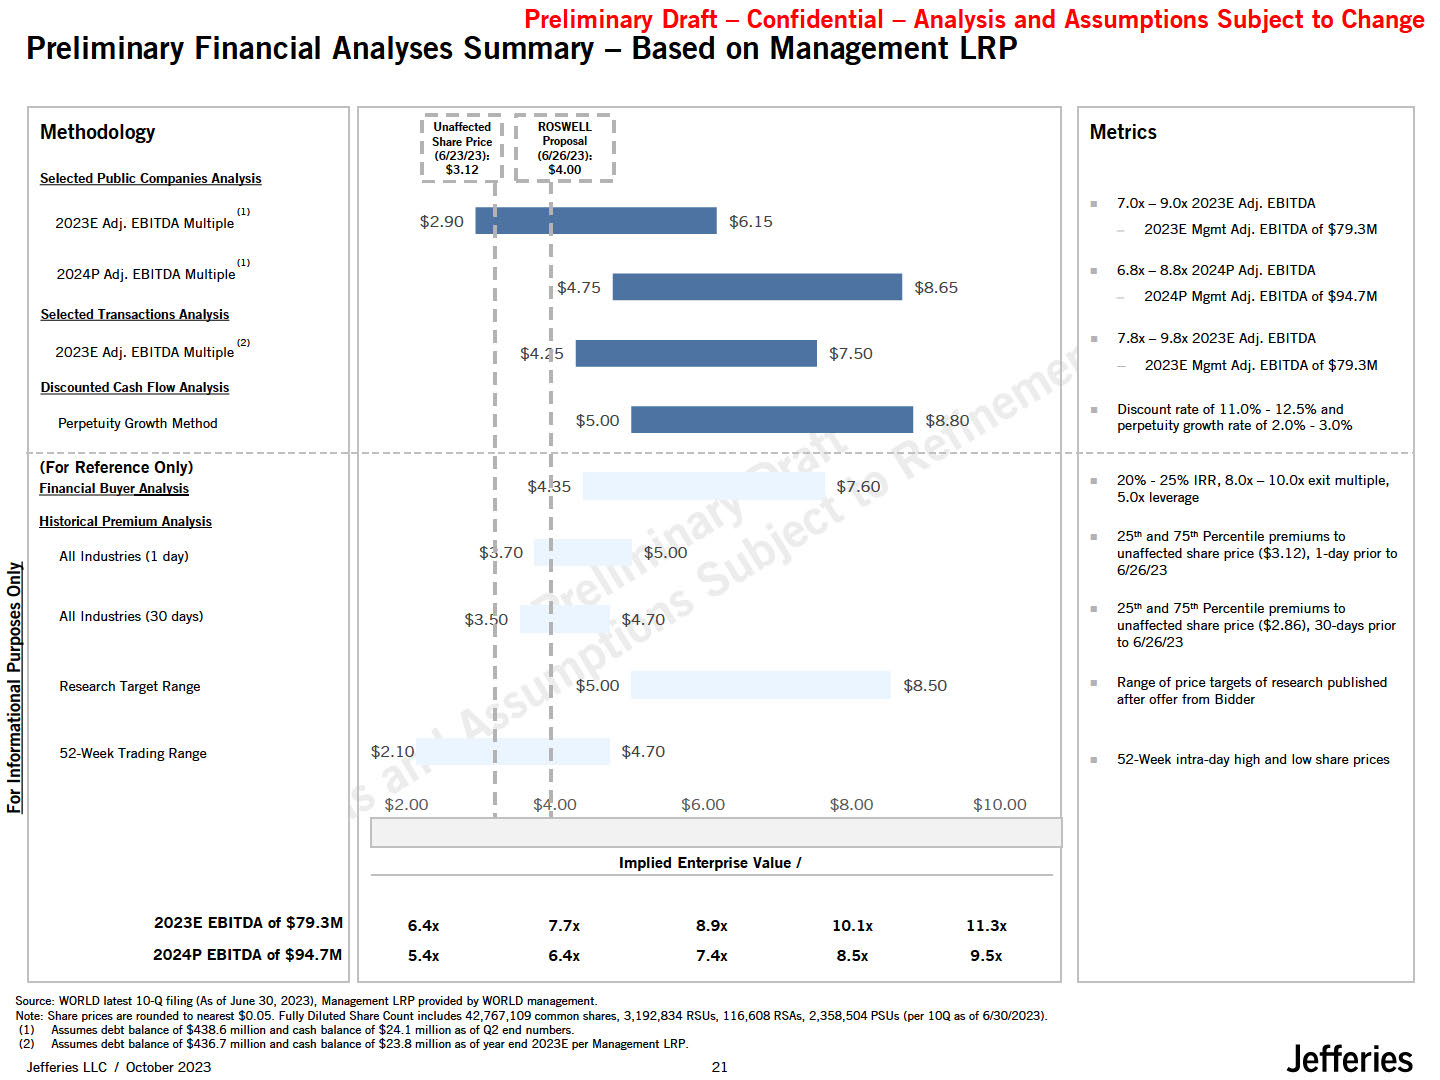
Change Preliminary Financial Analyses Summary - Based on Management LRP c 0 "Ill' "' Methodology Selected Public Companies Analysis (I) 2023E Adj. EBITDA Multiple (I) 2024P Adj. EBITDA Multiple Selected Transactions
Analysis 2 2023E Adj. EBITDA Multiple< > Discounted Cash flow Analysis Perpetuity Growth Method (For Reference Only) financial Buyer Analysis Historical Premium Analysis All Industries (1 day) All Industries (30 days) Research
Target Range 52-Week Trading Range 2023E EBITDA of $79.3M 2024P EBITDA of $94.7M $6.15 I I 1$4.75 $8.65 I I $4.:iJ5 $7.50 I I fI I $5.00 rI $8.80 1 I I $4
5 $7.60 $l10 I I $5.oo $3.10 $4.70 $5.00 $8.50 $2.10 $4.70 $2.00 $6.00 $8.00 $10.00 Implied Enterprise Value/ 6.4x 7.7x 8.9x 10.lx ll.3x S.4x 6.4x 7.4x 8.Sx 9.Sx Jefferies Jefferies LLC / October 2023 21 Metrics 7.0x -
9.0x 2023E Adj. EBITDA 2023E Mgmt Adj. EBITDA of $79.3M 6.8x - 8.8x 2024P Adj. EBITDA 2024P Mgmt Adj. EBITDA of $94.7M 7.8x-9.8x2023EAdj. EBITDA - 2023E Mgmt Adj. EBITDAof $79.3M Discount rate of 11.0% - 12.5% and perpetuity growth rate
of 2.0% - 3.0% 20% - 25% IRR, 8.0x - 10.0x exit multiple, 5.0x leverage 25"' and 75th Percentile premiums to unaffected share price ($3.12), 1-day prior to 6/26/23 25"' and 75th Percentile premiums to unaffected share price ($2.86),
30-days prior to 6/26/23 Range of price targets of research published after offer from Bidder 52-Week intra-day high and low share prices Source: WORLD latest 10-Q filing (Asof June 30, 2023), Management LRPprovided by WORLD
management. Note: Share prices are rounded to nearest $0.05. Fully Diluted Share Count includes 42,767,109 common shares, 3,192,834 RSUs, 116,608 RSAs, 2,358,504 PSUs (per lOQ as of 6130/2023). (I) Assumes debt balance of $438.6 million and
cash balance of $24.1 million as of Q2 end numbers. (2) Assumes debt balance of $436.7 million and cash balance of $23.8 million as of year end 2023E per Management LRP.
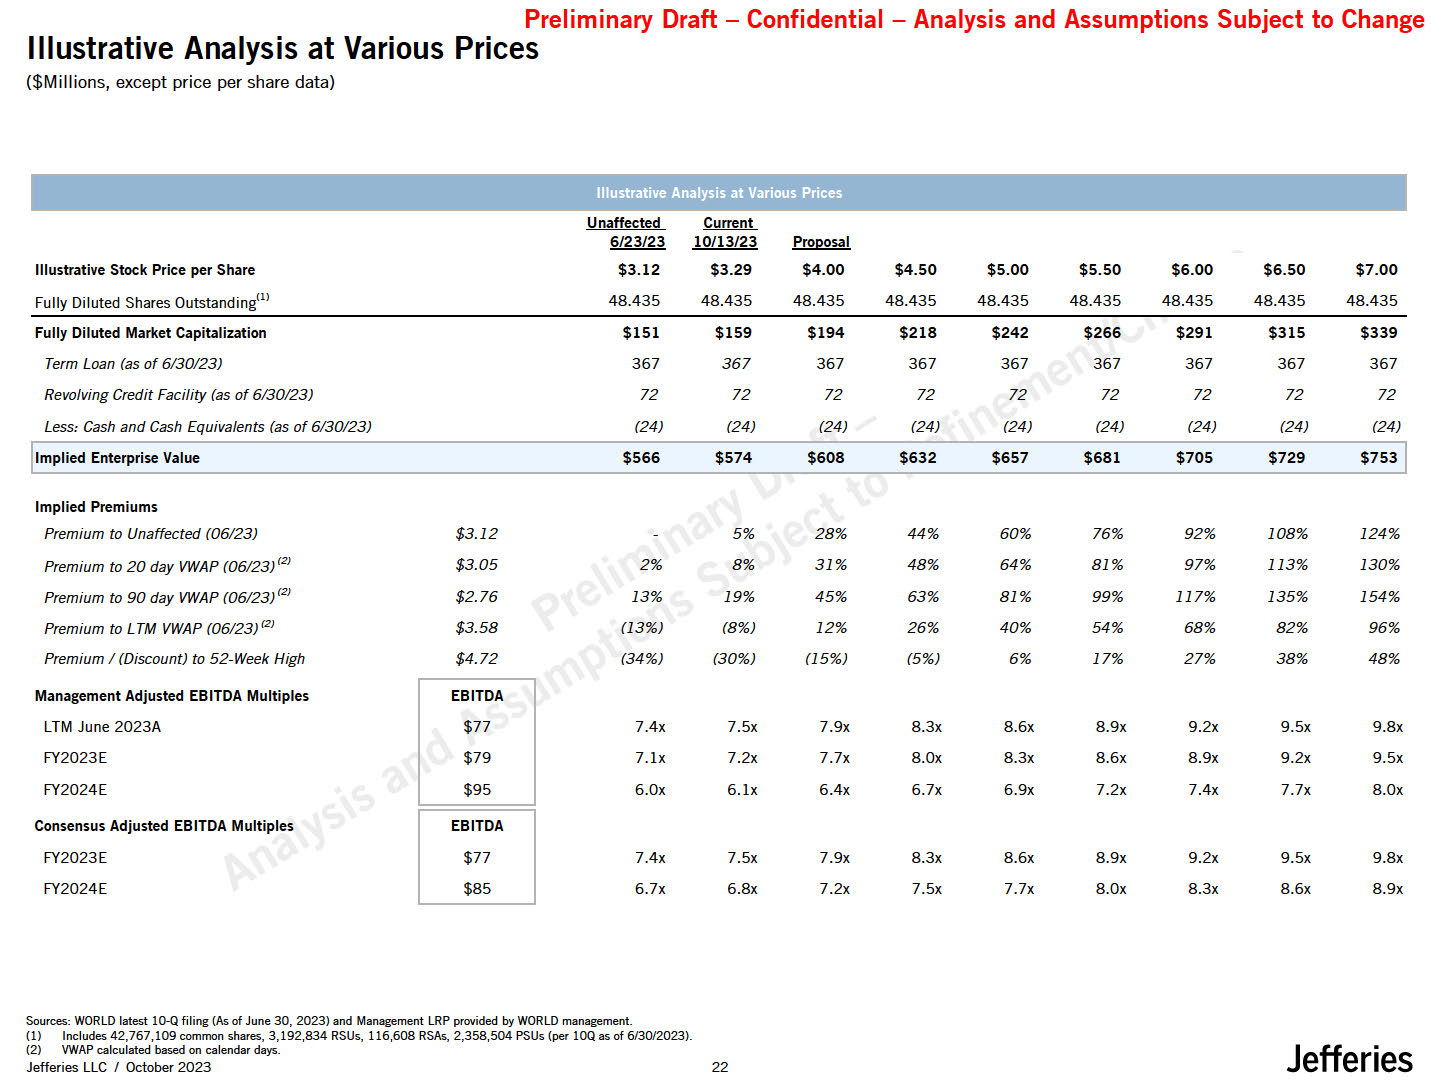
Unaffected Current 6/23/23 10/13/23 Proposal Illustrative Stock Price per
Share $3.12 $3.29 $4.00 $4.50 $5.00 $5.50 $6.00 $6.50 $7.00 Fully Diluted Shares Outstanding11> 48.435 48.435 48.435 48.435 48.435 48.435 48.435 48.435 48.435 Fully Diluted Market
Capitalization $151 $159 $194 $218 $242 $266 $291 $315 $339 Term Loan (as of 6/30/23) 367 367 367 367 367 367 367 367 367 Revolving Credit Facility (as of 6/30/23) 72 72 72 72 72 72 72 72 72 Less: Cash and Cash
Equivalents (as of 6/30/23) (24) (24) (24) (24) (24) (24) (24) (24) (24) Implied Enterprise Value $566 $574 $608 $632 $657 $681 $705 $729 $753 Implied Premiums Premium to Unaffected
(06/23) $3.12 5% 28% 44% 60% 76% 92% 108% 124% Premium to 20 day VWAP (06/23)121 $3.05 2% 8% 31% 48% 64% 81% 97% 113% 130% Premium to 90 day VWAP (06/23)121 $2.76 13% 19% 45% 63% 81% 99% 117% 135% 154% Premium to
LTM VWAP (06/23)121 $3.58 (13%) (8%) 12% 26% 40% 54% 68% 82% 96% Premium I (Discount) to 52-Week High $4.72 (34%) (30%) (15%) (5%) 6% 17% 27% 38% 48% Management Adjusted EBITDA Multiples EBITDA LTM June
2023A $77 7.4x 7.5x 7.9x 8.3x 8.6x 8.9x 9.2x 9.5x 9.8x FY2023E $79 7.lx 7.2x 7.7x 8.0x 8.3x 8.6x 8.9x 9.2x 9.5x FY2024E $95 6.0x 6.lx 6.4x 6.7x 6.9x 7.2x 7.4x 7.7x 8.0x Consensus Adjusted EBITDA
Multiples EBITDA FY2023E $77 7.4x 7.5x 7.9x 8.3x 8.6x 8.9x 9.2x 9.5x 9.8x FY2024E $85 6.7x 6.8x 7.2x 7.5x 7.7x 8.0x 8.3x 8.6x 8.9x Preliminary Draft - Confidential - Illustrative Analysis at Various Prices ($Millions,
except price per share data) Analysis and Assumptions Subject to Change Illustrative Analysis at Various Prices Sources: WORLD latest lM filing (Asof June 30, 2023) and Management LRPprovided by WORLD management. Includes 42,767,109 common
shares, 3,192,834 RSUs, 116,608 RSAs, 2,358,504 PSUs (per lOQ as of 6/30/2023). VWAP calculated based on calendar days. Jefferies LLC / October 2023 22 Jefferies
Preliminary Draft - Confidential - Analysis and Assumptions Subject to
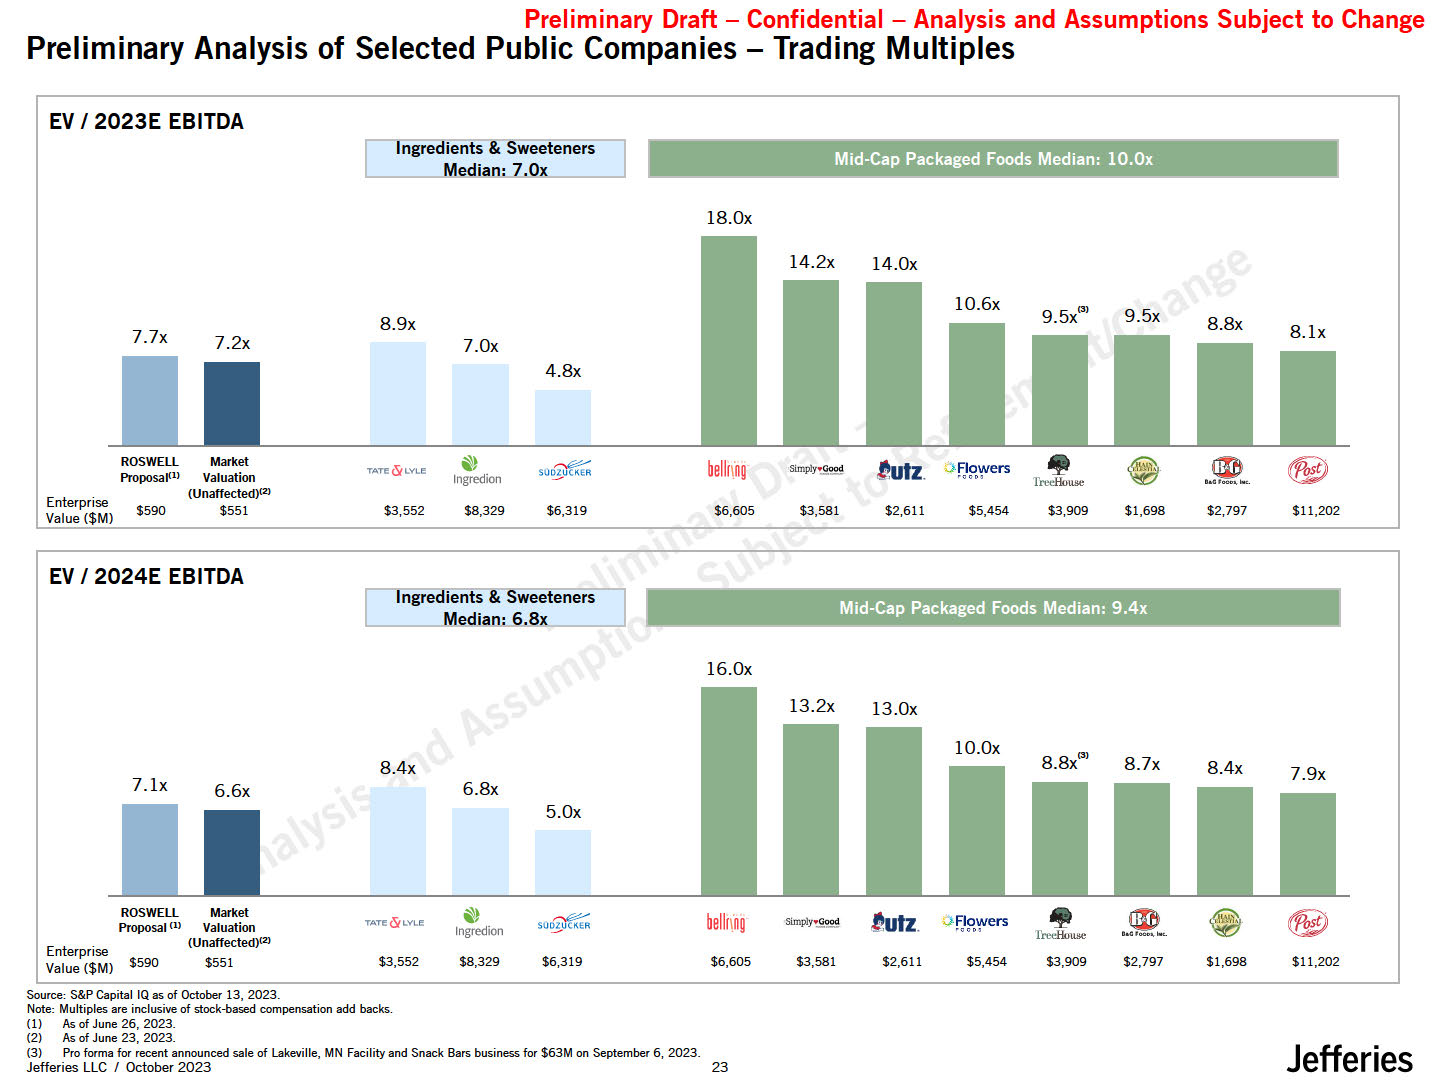
Change Preliminary Analysis of Selected Public Companies - Trading Multiples EV/ 2023E EBITDA Ingredients & Sweeteners edian: 7.0x Mid-Cap Packaged Foods Median: 10.0x 18.0x 7.7x 8.9x 7.2x 7.0x 4.8x Enterprise Value
($Ml ROSWELL ProposaJCll Market Valuation (Unaffected)l2l $551 $590 TATeO{Lv1.e } lngredion $3,552 $8,329 $6,319 bellf\RD $6,605 Simply $3,581 !utz. $2,611 • Tr,,.-eHouae $5,454 $3,909 $1,698 $2,797 $11,202 EV/ 2024E
EBITDA lngreclients & Sweeteners Median: 6.Sx _. Mid-Cap Packaged Foods Median: 9.4x 16.0x 7.lx 8.4x 6.6x 6.8x 5.0x ROSWELL Proposal01 Market Valuation (Unaffected)l2l $551 Enterprise Value ($Ml $59o TATf!O{LVI.C $3,552
$8,329 $6,319 } lngredion bellr1ng $6,605 Simply $3,581 $2,611 $5,454 • l'redlmuie $3,909 $2,797 $1,698 $11,202 Source: S&P Capital IQasof October 13, 2023. Note: Multiples are inclusive of stock-based compensation add
backs. As of June 26, 2023. As of June 23, 2023. Proforma for recent announced sale of Lakeville, MN Facility and Snack Bars business for $63M on September 6, 2023. Jefferies LLC I October 2023 23 Jefferies
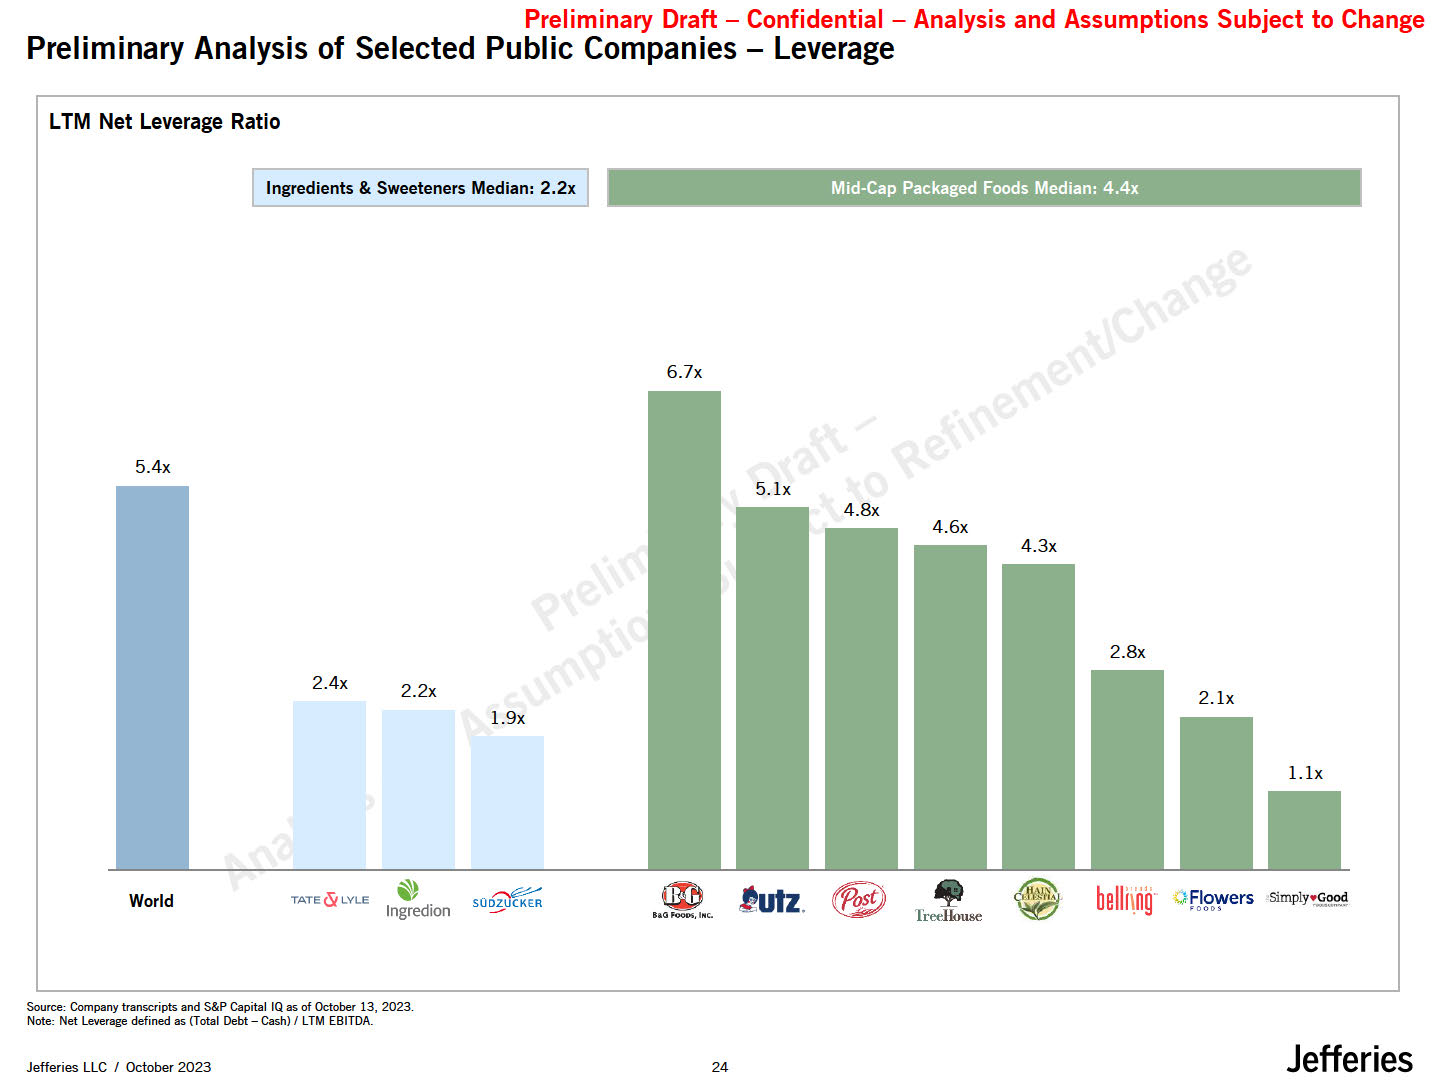
Preliminary Draft - Confidential - Preliminary Analysis of Selected Public
Companies - Leverage Jefferies Jefferies LLC / October 2023 25 Analysis and Assumptions Subject to Change LTM Net Leverage Ratio Ingredients & Sweeteners Median: 2.2x I 6.7x 5.4x 2.4x 2.2x l.9x World Mid-Cap Packaged Foods
Median: 4.4x TATEO{LVLE ., lngredion !utz. Tr•edlou&e bellifng· Source: Company transcripts and S&P Capital IQ asof October 13, 2023. Note: Net Leverage defined as(Total Debt-Cash)/ LTM EBITDA.
Preliminary Draft - Confidential - Analysis and Assumptions Subject to
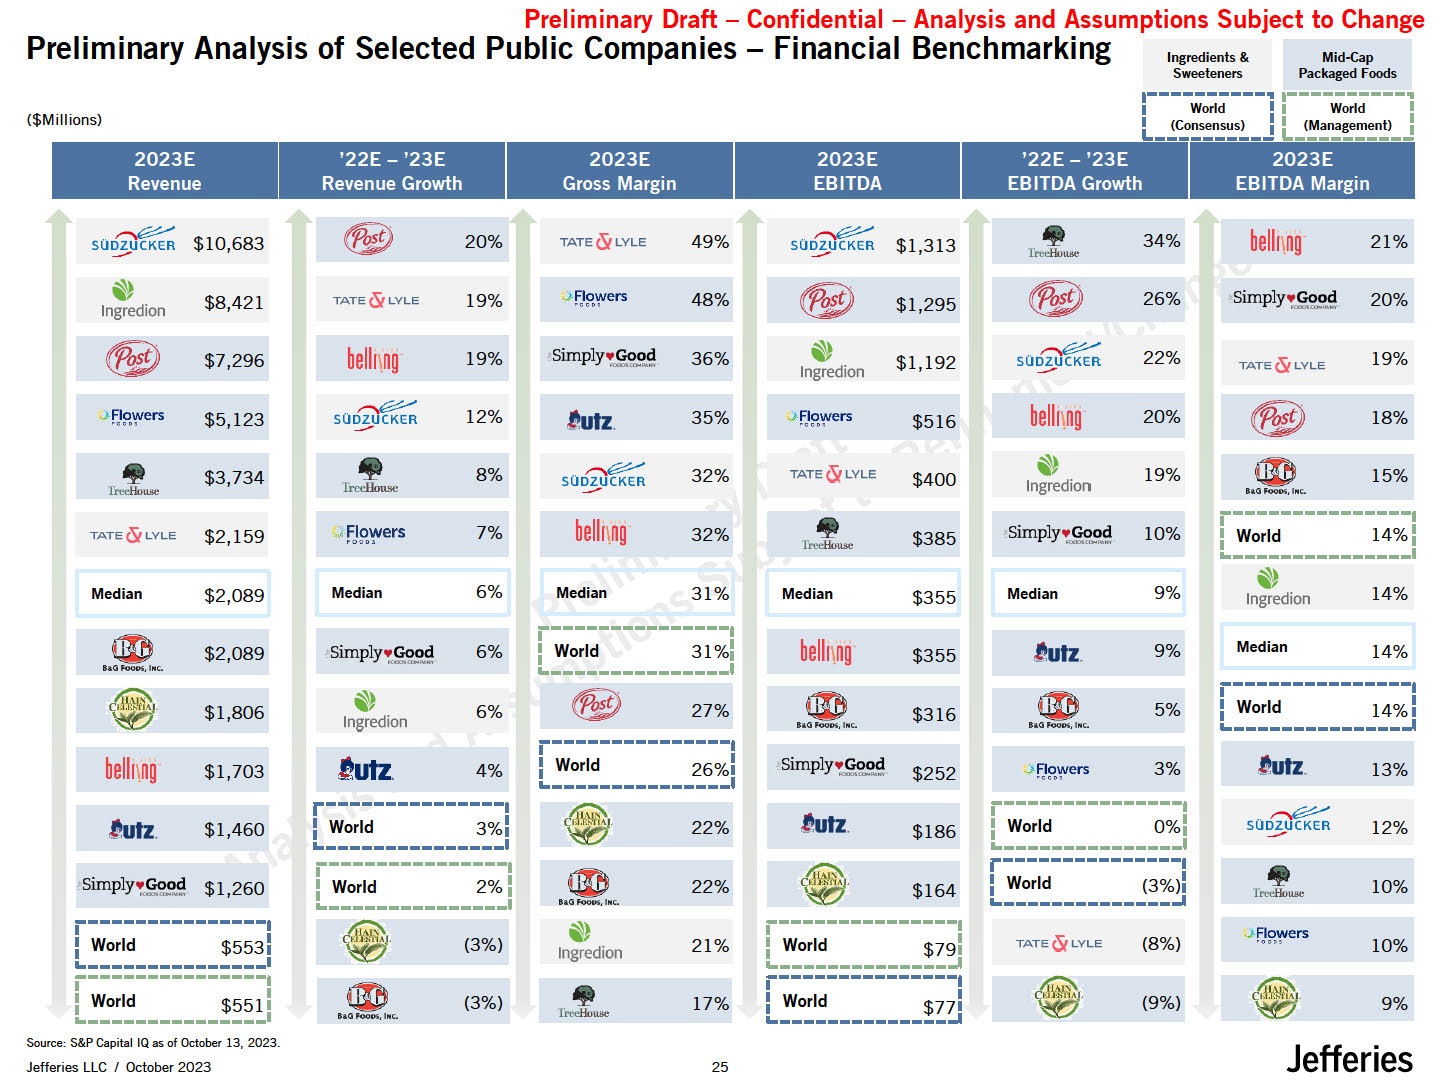
Change Preliminary Analysis of Selected Public Companies - Financial Benchmarking Ingredients & Sweeteners Mid•Cap Packaged foods ($Millions) 2023E Revenue '22E- '23E Revenue Growth 2023E Gross Margin 2023E EBITDA ,--I
----W-orl-d --·I·I----W-o-rld----I · L_! !!s.:.'!! -J l_ .:'!!!:!!'!n -J '22E- '23E 2023E EBITDA Growth EBITDA Margin Jefferies Jefferies LLC / October
2023 25 $10,683 20% TATE(YLYLE 49% $1,313 Tr•edlouse 34% bell11ng 21% $8,421 TATE(YLYLE 19% ..,,. l 'f"ers 48% $7,296 bellnng 19% Simply ,.,?._ 36% SOD- f) lngredion ® J· l
yJers $1,295 ® SOD 26% Simply 20% t'> SOD- ® lngredion $1,192 22% TATE(YLYLE 19% - $5,123 SOD- ...> l
YJe·rs $516 bellnng t') lngredion 20% ® 18% • $3,734 • TATE(YLYLE $400 19% 15% Tredlouse 'lrccHonse 12% 1.utz. 35% 8% SOD- 32% hO Fooosc, t111c. TATE(YLYLE $2,159 ,,fJ ers 7% bell11ng 32% Median $2,089 Median 6%
Median 31% • i---------------1 $385 Simply 2.'.! 10% ; World 14%; ft1.>elloUJ1e ---f-)-----------· M edian $355 Median 9% bell11ng $355 l.utz. 9% 14% lngredion r---------------1 $2,089 hO FootK,
htc. - $1,806 belh1ng $1,703 !utz. $1,460 imply '?.'.! $1,260 Simply '?.'.! 6% ; World 31 %; Median 14% ---------------• ') 6% i; -W--or-ld--------1-4-%-·; 27% $316 5% lngredion llO ,INC. llO
,INC. ---------------' i---------------· lutz. 4% ; World 26%; Simply 2.'.! $252 .J- l yvers 3% l.utz. 13% ---------------' r---------------1 - l.utz. i---------------· SOD- ; World 3%; 22% $186 ; World
0%; 12% i------------------------------·1 r------------------------------1' - $164 • S i---------------1 ; World 2%; 22% ; World
(3%); T:n.,"t:Hotu.e 10% -----------------· aaoJooos,'"'· } --------------..1 - i---------------, ..,.FJRY'ers ; World $553; (3%) Ingredion 21% ; World $79; TATE(YLYLE (8%) 10% ---- · 17% -I
------------------------------I.' : World $7?I --------------;.a ----------------. - C \,! I I • ; World $5511 (3%) (9%) - 9 Source: S&-P C-a-pit-al-IQ-a-s o-f -Oc-to-be-r 1-3-, 2-02·3. hO .btC. Tree&Ulle
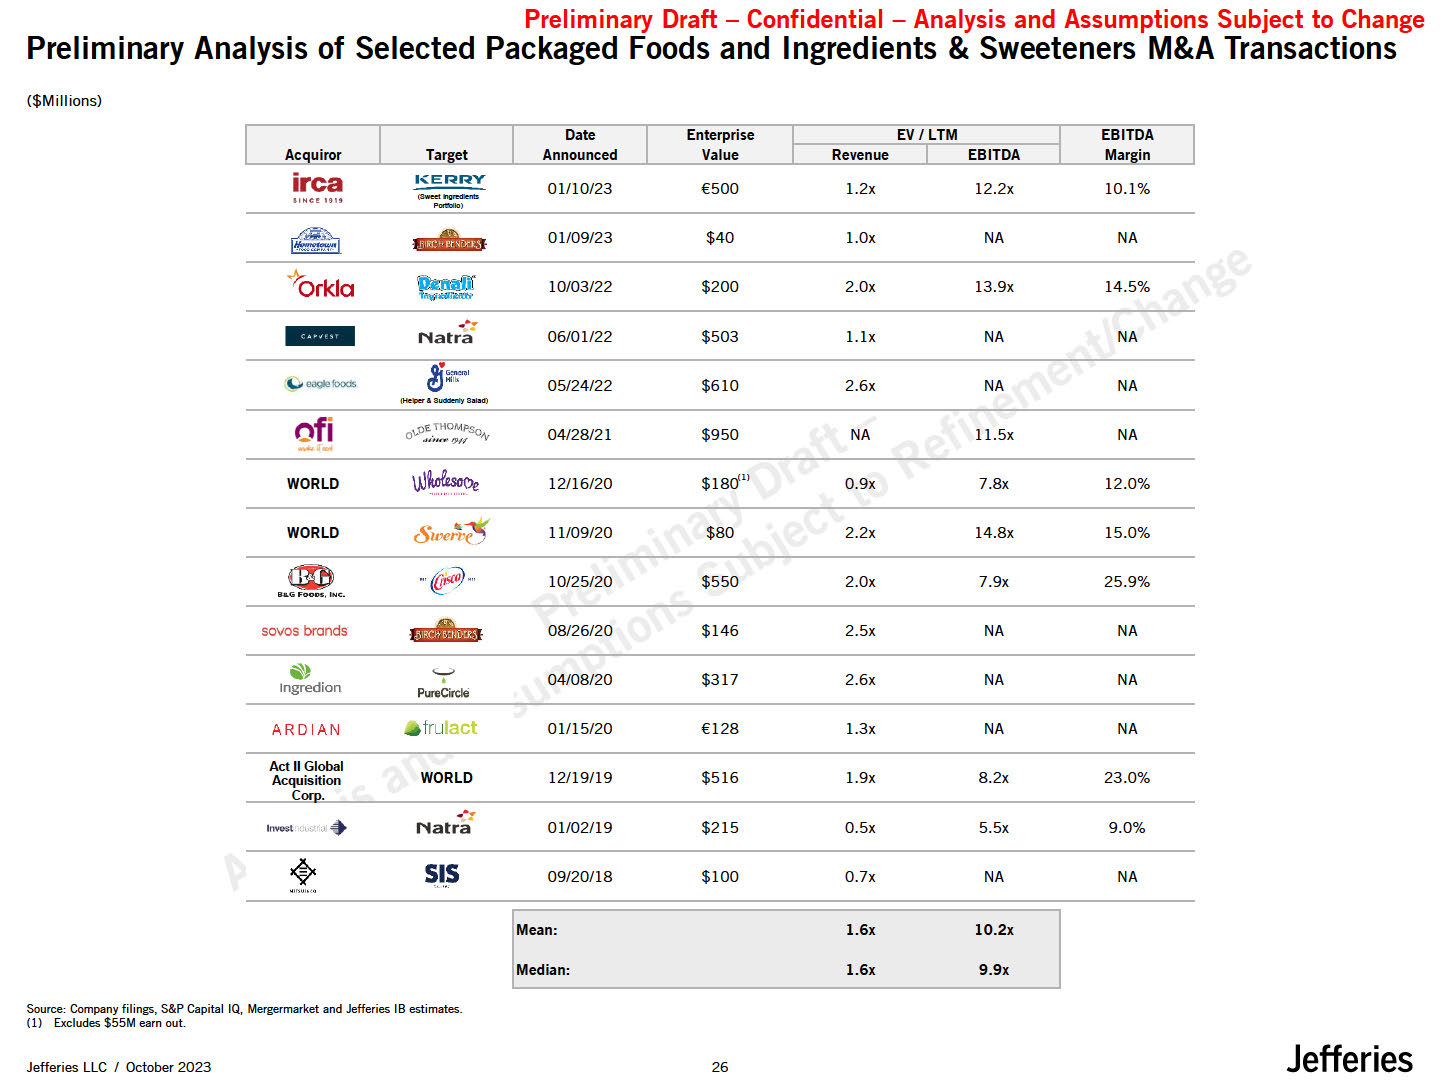
Date Enterprise EV /LTM EBITDA Ac uiror Tar et Announced Value Revenue
EBITDA Mar in Preliminary Draft - Confidential - Analysis and Assumptions Subject to Change Preliminary Analysis of Selected Packaged Foods and Ingredients & Sweeteners M&A Transactions ($Millions) irca llMC!
"" l,ERRY ................ 01/10/23 €500 l.2x 12.2x 10.1% POIO:lllo) a11afi!;:sg 01/09/23 $40 l.0x NA NA . ..Ji 'Orkla 10/03/22 $200 2.0x 13.9x 14.5% -·: Natra g._..,., 06/01/22 $503 l.lx NA NA .>QlefoOdS 05/24/22 $610 2.6x NA NA (H,el0ff&3Udl:lenly381a0) of..i ""ETHOMP5o 0
.i/-,.rr1>·N i'y 04/28/21 $950 NA l l.5x NA kG
Foo-.,..c:. PinC'll'Cki Acquisition WORLD w 12/16/20 $18du 0.9x 7.8x 12.0% WORLD 8u,e 11/09/20 $80 2.2x 14.8x 15.0% alb ··@1S£o/·· 10/25/20 $550 2.0x 7.9x 25.9% SOVOS brands ) 1ngredion l
lllil!il ._,;, • 08/26/20 04/08/20 $146 $317 2.5x 2.6x NA NA NA NA AR DIAN frulact 01/15/20 €128 l.3x NA NA Act II Global c . WORLD 12/19/19 $516 l.9x 8.2x 23.0% -: ltl\10$:l ,I
♦ Natra 01/02/19 $215 0.5x 5.5x 9.0% s.• 09/20/18 $100 0.7x NA NA t"" Jefferies Jefferies LLC / October 2023 25 l.6x 10.2x :ModOo, l.6x 9.9x Source: Company filings, S&P Capital IQ, Mergermarket and Jefferies IB
estimates. (1) Excludes $55M earn out.
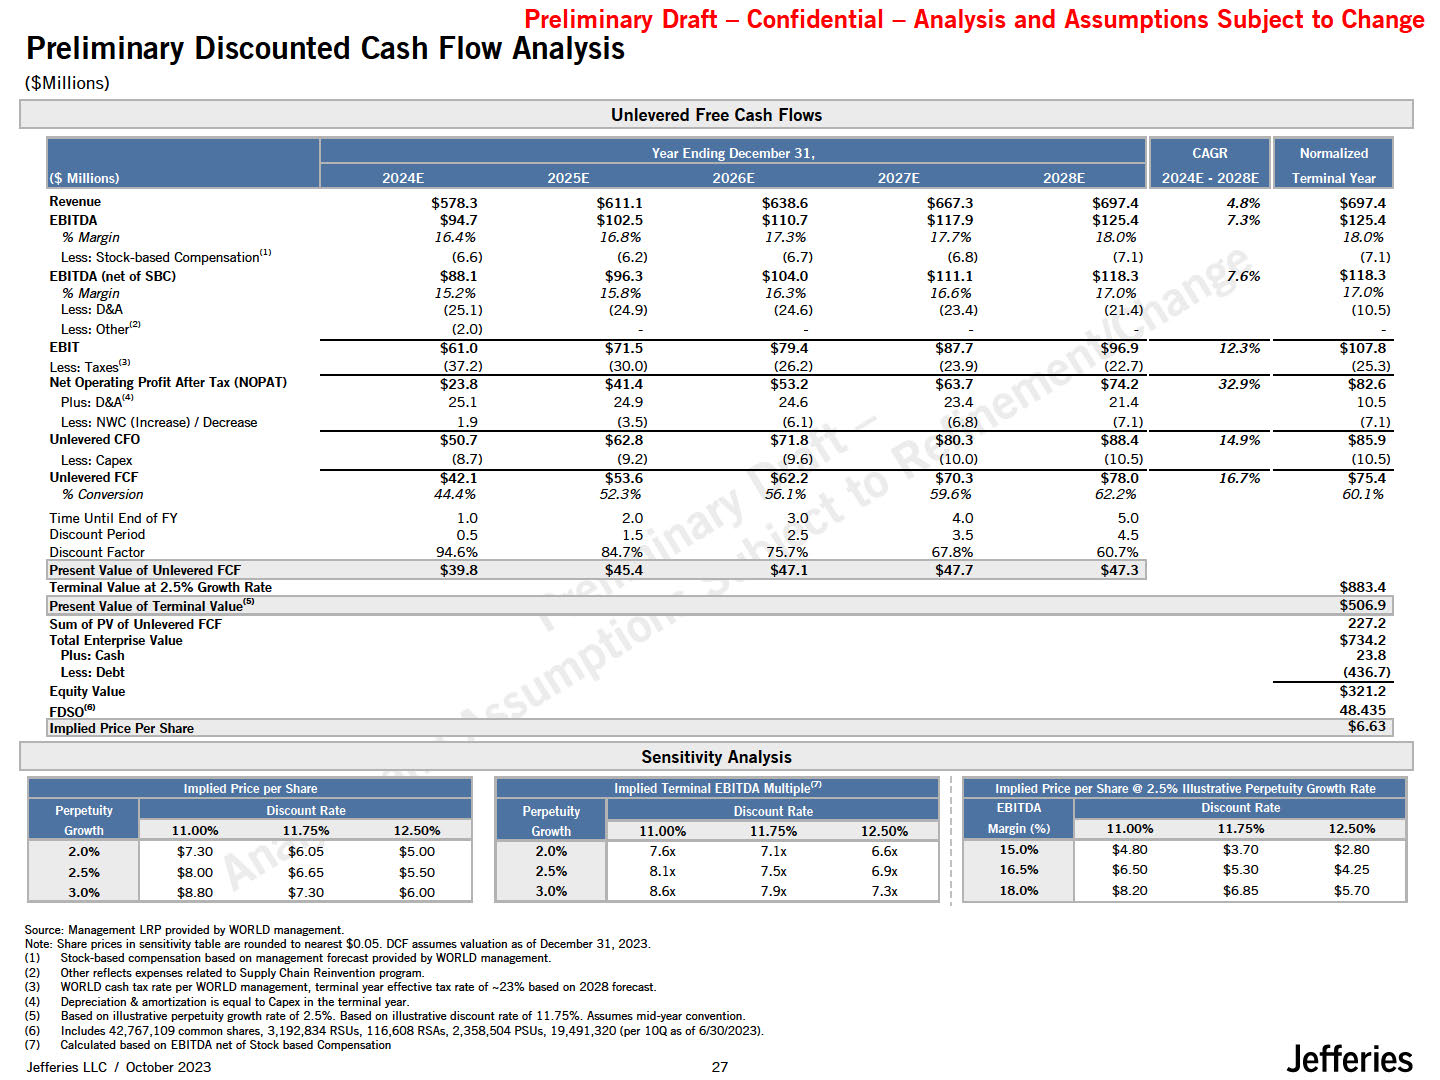
Preliminary Draft - Confidential - Preliminary Discounted Cash Flow
Analysis ($Millions) Analysis and Assumptions Subject to Change Unlevered Free Cash Flows I --•-- - Jefferies Jefferies LLC / October
2023 25 $578.3 $94.7 16.4% (6.6) $88.1 15.2% (25.1) (2.0) $611.1 $102.5 16.8% (6.2) $96.3 15.8% (24.9) $638.6 $110.7 17.3% (6.7) $104.0 16.3% (24.6) $667.3 $117.9 17.7% (6.8) $111.1 16.6% (23.4) $697.4 $125.4 18.0% (7.1) $118.3 17.0% (21.4) 4.8% 7.3% $697.4 $125.4 18.0% (7.1) $118.3 17.0% (10.5) 7.6% 12.3% $61.0
(37.2) $71.5 (30.0) $79.4 (26.2) $87.7 (23.9) $96.9 (22.7) $107.8 (25.3) 32.9% $23.8 25.1 1.9 $41.4 24.9 (3.5) $53.2 24.6 (6.1) $63.7 23.4 (6.8) $74.2 21.4 (7.1) $82.6 10.5 (7.1) 14.9% $50.7 (8.7) $62.8 (9.2) $71.8
(9.6) $80.3 (10.0) $88.4 (10.5) $85.9 (10.5) 16.7% $75.4 60.1% Revenue EBITDA % Margin Less: Stock-based Compensation<ll EBITDA (net of SBC) % Margin Less: D&A Less: other'21 EBIT Less: Taxes<•> Net Operating Profit
After Tax (NOPAT) Plus: D&A14> Less: NWC (Increase) I Decrease Unlevered CFO Less: Capex Unlevered FCF % Conversion Time Until End of FY Discount Period Discount
factor $42.1 44.4% 1.0 0.5 94.6% $53.6 52.3% 2.0 1.5 84.7% $62.2 56.1% 3.0 2.5 75.7% $70.3 59.6% 4.0 3.5 67.8% $78.0 62.2% 5.0 4.5 60.7% $39.8 $45.4 $47.1 $47.7 $47.31 !Present Value of Unlevered FCF Tenminal
Value at 2.5% Growth Rate $883.4 !Present Value of Terminal Value<•> $506.91 227.2 $734.2 23.8 (436.7) Sum of PV of Unlevered FCF Total Enterprise Value Plus: Cash Less: Debt Equity Value FDso<•> $321.2 48.435 Im lied
Price Per Share $6.63 Sensitivity
Analysis 2.0% 2.0% 7.6x 7.lx 6.6x 15.0% 2.5% $8.00 $6.65 $5.50 2.5% 8.lx 7.5x 6.9x 16.5% $6.50 $5.30 $4.25 3.0% $8.80 $7.30 $6.00 3.0% 8.6x 7.9x 7.3x 18.0% $8.20 $6.85 $5.70 Source: Management LRP provided by
WORLD management. Note: Share prices in sensitivity table are rounded to nearest $0.05. DCF assumes valuation as of December 31, 2023. Stock-based compensation based on management forecast provided by WORLD management. Other reflects
expenses related to Supply Chain Reinvention program. WORLD cash tax rate per WORLD management, terminal year effective tax rate of -23% based on 2028 forecast. Depreciation & amortization is equal to Capex in the terminal year. Based on
illustrative perpetuity growth rate of 2.5%. Based on illustrative discount rate of 11.75%. Assumes mid-year convention. Includes 42,767,109 common shares, 3,192,834 RSUs, 116,608 RSAs, 2,358,504 PSUs, 19,491,320 (per lOQ asof
6/30/2023). Calculated based on EBITDA net of Stock based Compensation
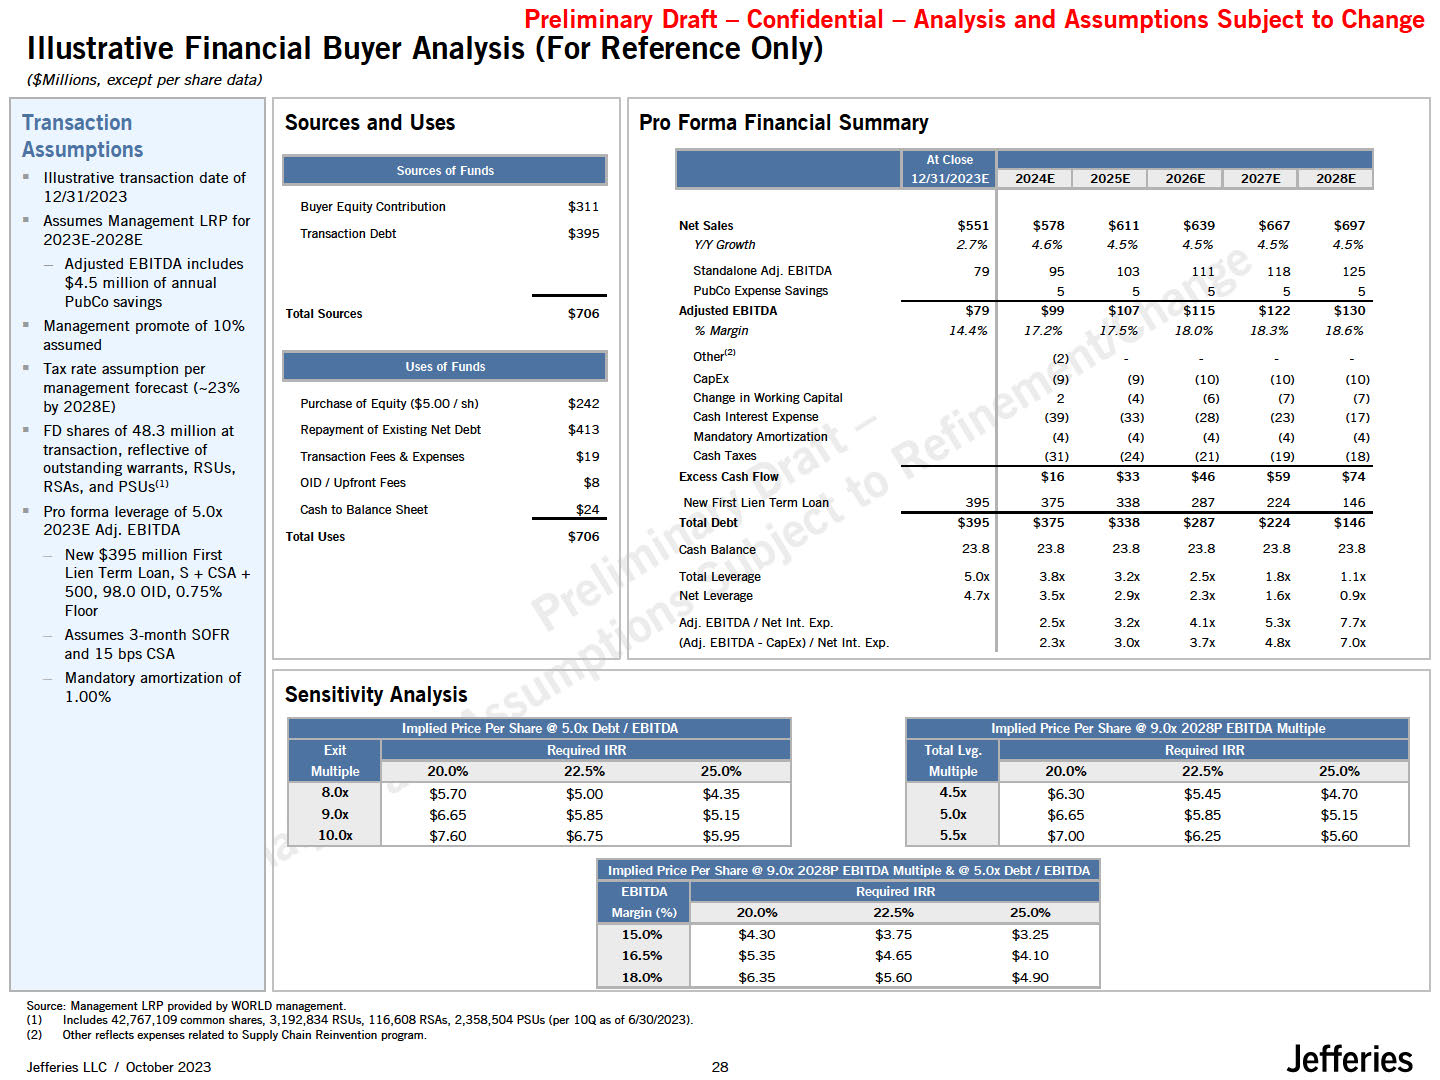
Preliminary Draft - Confidential - Analysis and Assumptions Subject to
Change Illustrative Financial Buyer Analysis (For Reference Only) ($Millions, except per share data) Illustrative transaction date of 12/31/2023 Assumes Management LRP for 2023E-2028E Adjusted EBITDA includes $4.5 million of annual PubCo
savings Management promote of 10% assumed Tax rate assumption per management forecast (-23% by 2028E) FD shares of 48.3 million at transaction, reflective of outstanding warrants, RSUs, RSAs, and PSUs<ll Pro forma leverage of 5.0x
2023E Adj. EBITDA New $395 million First Lien Term Loan, S +CSA+ 500, 98.0 0ID, 0.75% Floor Assumes 3-month SOFR and 15 bps CSA Mandatory amortization of 1.00% Sources of Funds Buyer Equity Contribution Transaction Debt Total
Sources $311 $395 $706 Uses of Funds • Jefferies Jefferies LLC / October 2023 25 Purchase of Equity ($5.00 I sh) Repayment of Existing Net Debt Transaction Fees & Expenses 01D I Upfront Fees $242 $413 $19 $8 $24 Gash to
Balance Sheet Total Uses $706 Transaction Sources and Uses Pro Forma Financial Summary Assumptions Net Sales $551 $578 $611 $639 $667 $697 YIYGrowth 2.7% 4.6% 4.5% 4.5% 4.5% 4.5% Standalone Adj.
EBITDA 79 95 103 111 118 125 PubC-0 Expense Savings Adjusted EBITDA 5 5 5 5 5 $79 $99 $107 $115 $122 $130 % Margin 14.4% 17.2% 17.5% 18.0% 18.3% 18.6% Other12l (2) CapEx (9) (9) (10) (10) (10) Change in Worl<ing
Capital 2 (4) (6) (7) (7) Cash Interest Expense (39) (33) (28) (23) (17) Mandatory Amortization (4) (4) (4) (4) (4) (31) (24) (21) (19)
(18) 3951 $16 375 $33 338 $46 287 $59 224 $74 146 $395 23.8 $375 23.8 $338 23.8 $287 23.8 $224 23.8 $146 23.8 5.0x 4.7x 3.8x 3.5x 3.2x 2.9x l.8x l.6x l.lx 0.9x Cash Taxes Excess cash Flow New First Lien Term
Loan Total Debt Gash Balance Total Leverage Net Leverage Adj. EBITDA / Net Int. Exp. (Adj. EBITDA - CapEx) / Net Int. Exp. 2.5x 2.3x 3.2x 3.0x 2.5x 2.3x 4.lx 3.7x 5.3x 4.8x 7.7x 7.0x Sensitivity Analysis 10.0x $7.60
$6.75 $5.95 I •t • . I' . (£•I I ' 20.0% 22.5% 25.0% 20.0% 22.5% 25.0% 8.0x $5.70 $5.00 $4.35 $6.30 $5.45 $4.70 9.0x $6.65 $5.85 $5.15 $6.65 $5.85 $5.15 $6.25 $5.60 I
• 20.0% 22.5% 25.0% 15.0% 16.5% 18.00/4 $4.30 $5.35 $6.35 $3.75 $4.65 $5.60 $3.25 $4.10 $4.90 Source: Management LRP provided by WORLD management. Includes 42,767,109 common shares, 3,192,834 RSUs, 116,608 RSAs, 2,358,504 PSUs
(per 100 as of 6/30/2023). Other reflects expenses related to Supply Chain Reinvention program.
Preliminary Draft - Confidential - Analysis and Assumptions Subject to
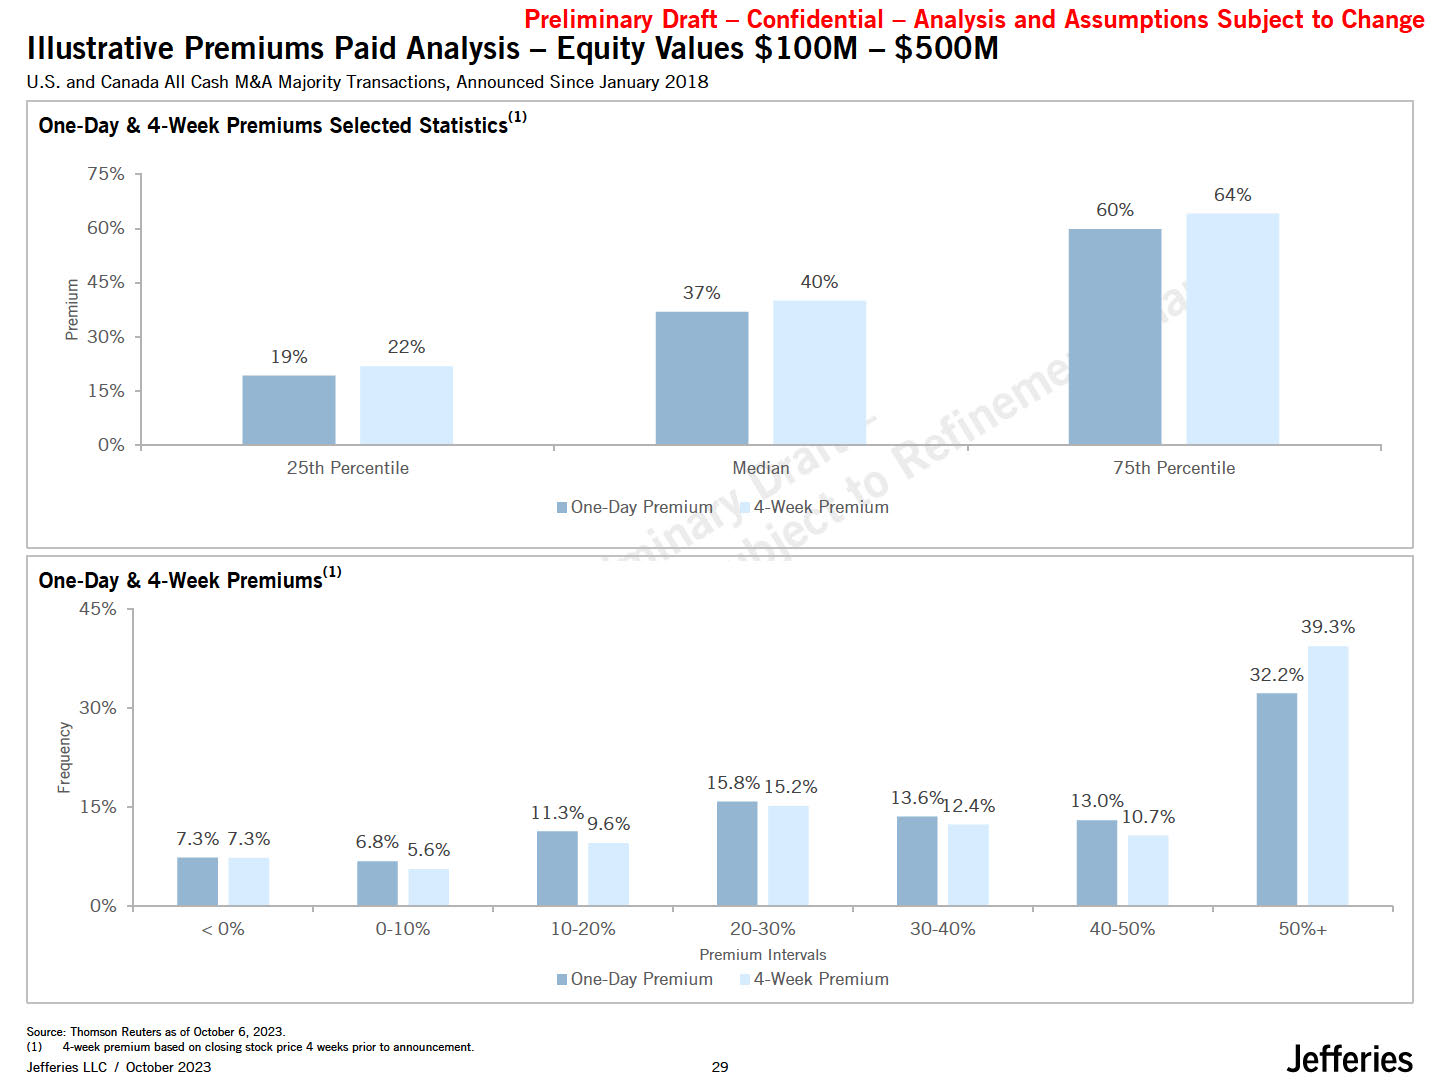
Change Illustrative Premiums Paid Analysis - Equity Values $100M - $500M U.S. and Canada All Cash M&A Majority Transactions, Announced Since January 2018 One-Day & 4-Week Premiums Selected Statisticsm 75% 60% E 45% .:E, ., ct
30% 60% 64% 37% 40% 19% 22% 15% 0% 25th Percentile Median 4-Week Premium 75th Percentile One-Day Premium One-Day & 4-Week Premiumsm 45% 39.3% 32.2% 30% >. .'c-:,': :, r:::r ., Lt 15% 7.3%
7.3% 0% <0% 15.8%15.2% 6.8% 5.6% 11.3%9.6% 0-10% 13.6o/°l.2.4% 13.0% 10.7% 10-20% 20-30% Premium Intervals 30-40% 40-50% 50%+ One-Day Premium 4-Week Premium Source: Thomson Reuters as of October 6, 2023. (1} 4-week premium
based on closing stock price 4 weeks prior to announcement. Jefferies LLC / October 2023 29 Jefferies
Preliminary Draft - Confidential - Analysis and Assumptions Subject to
Change Jefferies Jefferies LLC / October 2023 31 Appendix
Preliminary Draft - Confidential - Analysis and Assumptions Subject to
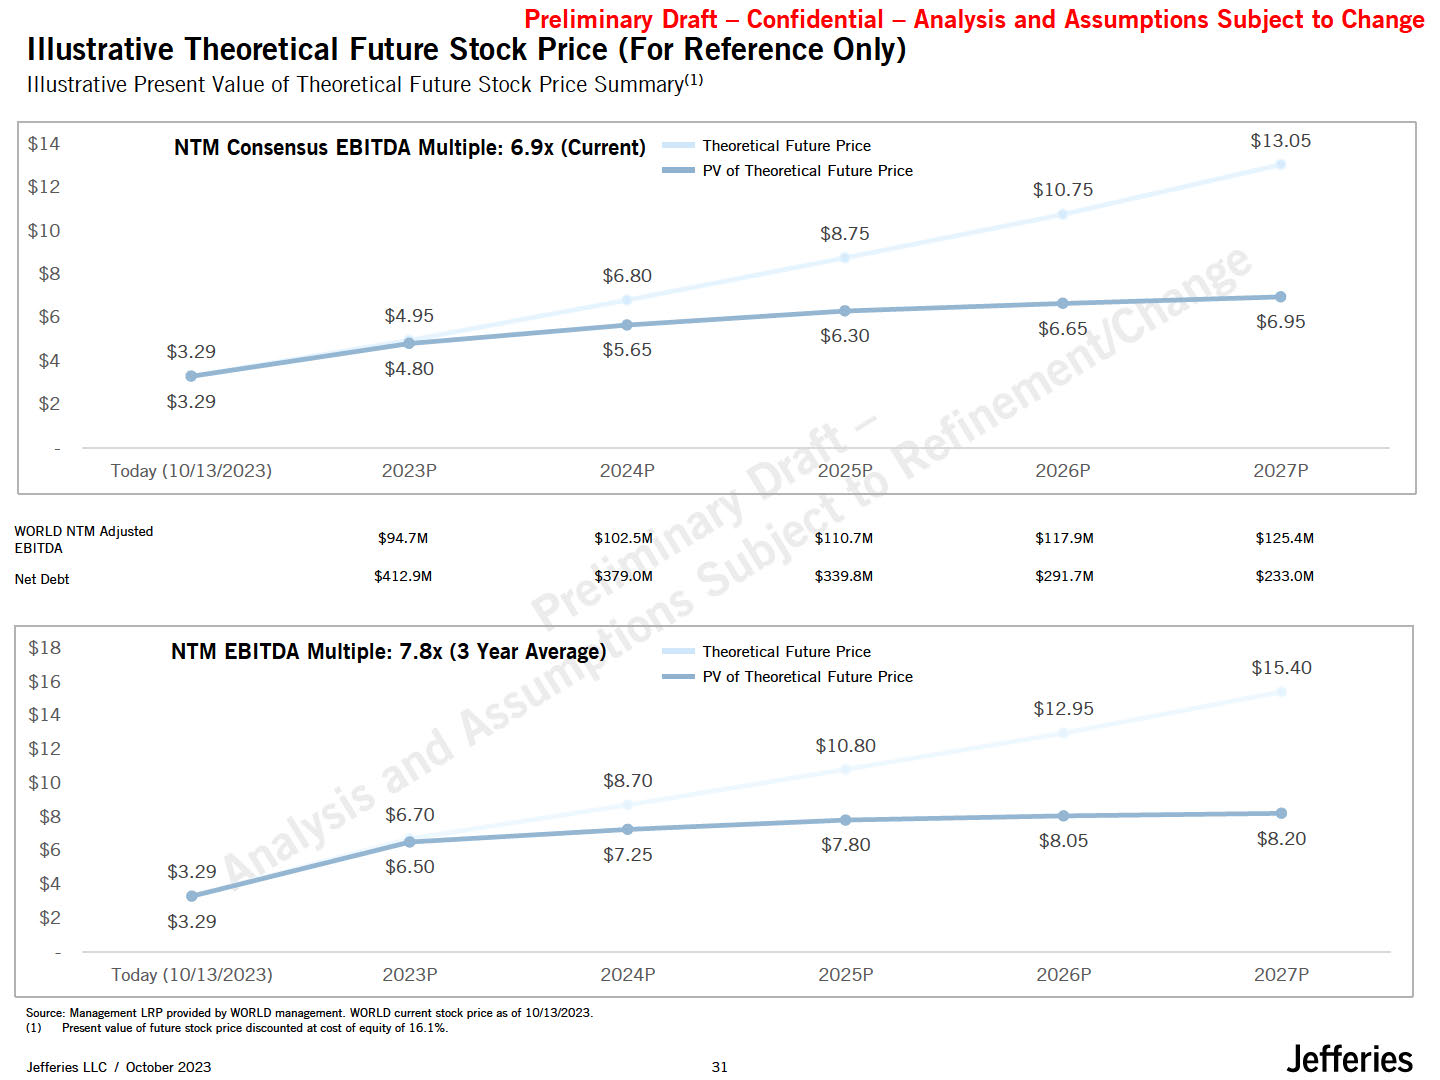
Change Illustrative Theoretical Future Stock Price (For Reference Only) Illustrative Present Value of Theoretical Future Stock Price Summarym $14 NTM Consensus EBITDA Multiple: 6.9x (Current) $13.05 Theoretical Future Price - PV of
Theoretical Future Price $12 $10.75 $10 $8.75 $8 $6.80 • • $6 $4.95 • $6.95 • $6.30 $6.65 $3.29 $5.65 $4 .. rt $4.80 $2 $3.29 Today (10/13/2023) 2023P 2024P 2025P 2026P 2027P WORLD NTM Adjusted EBITDA Net
Debt $94.7M $102.5M $110.7M $117.9M $125.4M $412.9M $379.0M $339.BM $291.7M $233.0M I $7.25 Jefferies Jefferies LLC / October 2023 31 $18 $16 NTM EBITDA Multiple: 7.8x (3 Year Average) - Theoretical Future Price PV of
Theoretical Future Price $15.40 $14 $12.95 $12 $10.80 $10 $8.70 $8 $6 $6.70 • • $7.80 • $8.05 • $8.20 $4 $3 6.50 $2 $3.29 Today {10/13/2023) 2023P Source: Management LRP provided by WORLD management. WORLD current stock
price as of 10/13/2023. (1) Present value of future stock price discounted at cost of equity of 16.1%. 2024P 2025P 2026P 2027P
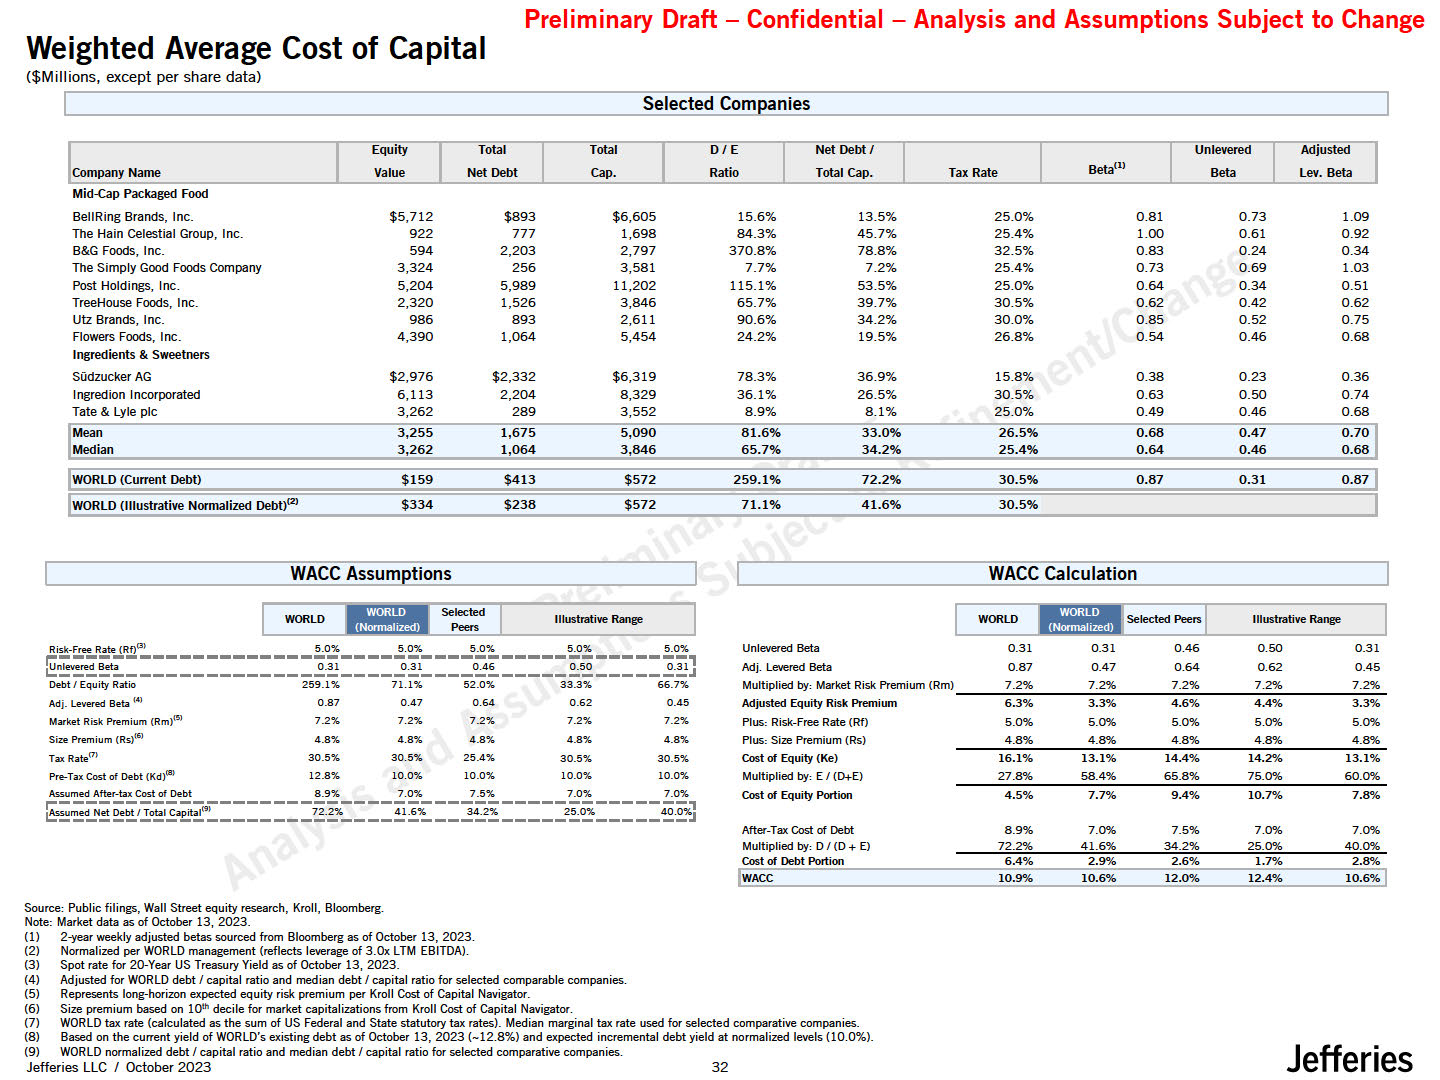
Weighted Average Cost of Capital ($Millions, except per share data) Preliminary
Draft - Confidential - Analysis and Assumptions Subject to Change lwoRLD (Illustrative Normalized Oebt)l2l $334 $238 Company Name Equity Value Total Net Debt Total cap. 0/E Ratio Net Debt/ Total Cap. Tax
Rate Beta11> Unlevered Beta Adjusted Lev. Beta Mid p Packaged Food BellRing Brands, Inc. $5,712 $893 $6,605 15.6% 13.5% 25.0% 0.81 0.73 1.09 The Hain Celestial Group,
Inc. 922 777 1,698 84.3% 45.7% 25.4% 1.00 0.61 0.92 B&G Foods, Inc. 594 2,203 2,797 370.8% 78.8% 32.5% 0.83 0.24 0.34 The Simply Good Foods Company 3,324 256 3,581 7.7% 7.2% 25.4% 0.73 0.69 1.03 Post Holdings,
Inc. 5,204 5,989 11,202 115.1% 53.5% 25.0% 0.64 0.34 0.51 TreeHouse Foods, Inc. 2,320 1,526 3,846 65.7% 39.7% 30.5% 0.62 0.42 0.62 Utz Brands, Inc. 986 893 2,611 90.6% 34.2% 30.0% 0.85 0.52 0.75 Flowers Foods,
Inc. 4,390 1,064 5,454 24.2% 19.5% 26.8% 0.54 0.46 0.68 Ingredients & Sweetners Sudzucker AG $2,976 $2,332 $6,319 78.3% 36.9% 15.8% 0.38 0.23 0.36 Ingred ion
Incorporated 6,113 2,204 8,329 36.1% 26.5% 30.5% 0.63 0.50 0.74 Tate & Lyle
pie 3,262 289 3,552 8.9% 8.1% 25.0% 0.49 0.46 0.68 Mean 3,255 1,675 5,090 81.6% 33.0% 26.5% 0.68 0.47 0.70 Median 3,262 1,064 3,846 65.7% 34.2% 25.4% 0.64 0.46 0.68 !WORLD (Current
Debt) $159 $413 $572 259.1% 72.2% 30.5% 0.87 0.31 0.871 Selected Companies $572 71.1% 41.6% 30.5% I WACC Assumptions WORLD Selected Pee,s Illustrative Range :i-Riesk-Fvree-R:at: med Net Debt/ Total CapitalC91 ---- 72.2%
41.6% 34.2% ---- 25.0% 40.0%J WACC Calculation 1111•1,l'ected PeersI 1 5.0% 5.0% 5.0% 5.0% 5.0% Unlevered Beta 0.31 0.31 0.46 0.50 0.31 e :(Rft)C:3 ----------------;_;'i---- r;l----;;-;----- ------;_';iJ Adj. Levered
Beta 0.87 0.47 0.64 0.62 0.45 Oe.bt/EquityR.tio 259.1% 71.1% 52.0% 33.3% 6-6.7% Multiplied by, Markel Risk Premium (Rm) 7.2% 7.2% 7.2% 7.2% 7.2% Adj. Levered Beta (,4) 0.87 0.47 0.64 0.62 0.45 Adjusted Equity Risk
Premium 6.3% 3.3% 4.6% 4.4% 3.3% Market Risk Premium (Rm} > 7.2% 7.2% 7.2% 7.2% 7.2% Plus, Risk-FreeRate (Rf) 5.0% 5.0% 5.0% 5.0% 5.0% Size Premium (Rs}l6) 4.8% 4.8% 4.8% 4.8% 4.8% Plus: Size Premium
(Rs) 4.8% 4.8% 4.8% 4.8% 4.8% Tax Ratem 30.5% 30.5% 25.4% 30.5% 30.5% Cost of Equity (Ke) 16.1% 13.1% 14.4% 14.2% 13.1% Pre-Tax Cost of Debt {Kd)W 12.8% 10.0% 10.0% 10.0% 10.0% Multiplied by: E /
(D+E) 27.8% 58.4% 65.8% 75.0% 60.0% Assumed Aftef.taxCostof Debt 8.9% 7.0% 7.5% 7.0% 7.0% Cost of Equity Portion 4.5% 7.7% 9.4% 10.7% 7.8% WORLD Illustrative Range After-Tax Cost of Debt Multiplied by: D / (D+
E) 8.9% 72.2% 7.0% 41.6% 7.5% 34.2% 7.0% 25.0% 7.0% 40.0% Cost of Debt Portion 6.4% 2.9% 2.6% 1.7% 2.8% lwAcc 10.9% 10.6% 12.0% 12.4% 10.6%1 Source: Public filings, Wall Street equity research, Kroll, Bloomberg. Note: Market data
as of October 13, 2023. (1) 2-year weekly adjusted betas sourced from Bloomberg as of October 13, 2023. (2) Normalized per WORLD management (reflects leverage of 3.0x LTM EBITDA). (3) (4) (5) (6) (7) (8) (9) Spot rate for 20-Year US
Treasury Yield as of October 13, 2023. Adjusted for WORLD debt/ capital ratio and median debt/ capital ratio for selected comparable companies. Represents long-horizon expected equity risk premium per Kroll Cost of Capital Navigator. Size
premium based on 10th decile for market capitalizations from Kroll Cost of Capital Navigator. WORLD tax rate (calculated as the sum of US Federal and State statutory tax rates). Median marginal taxrate used for selected comparative companies.
Based on the current yield of WORLD's existing debt as of October 13, 2023 (-12.8%) and expected incremental debt yield at normalized levels (10.0%). WORLD normalized debt/ capital ratio and median debt I capital ratio for selected comparative
companies. Jefferies LLC / October 2023 32 Jefferies
Preliminary Draft - Confidential - Analysis and Assumptions Subject to
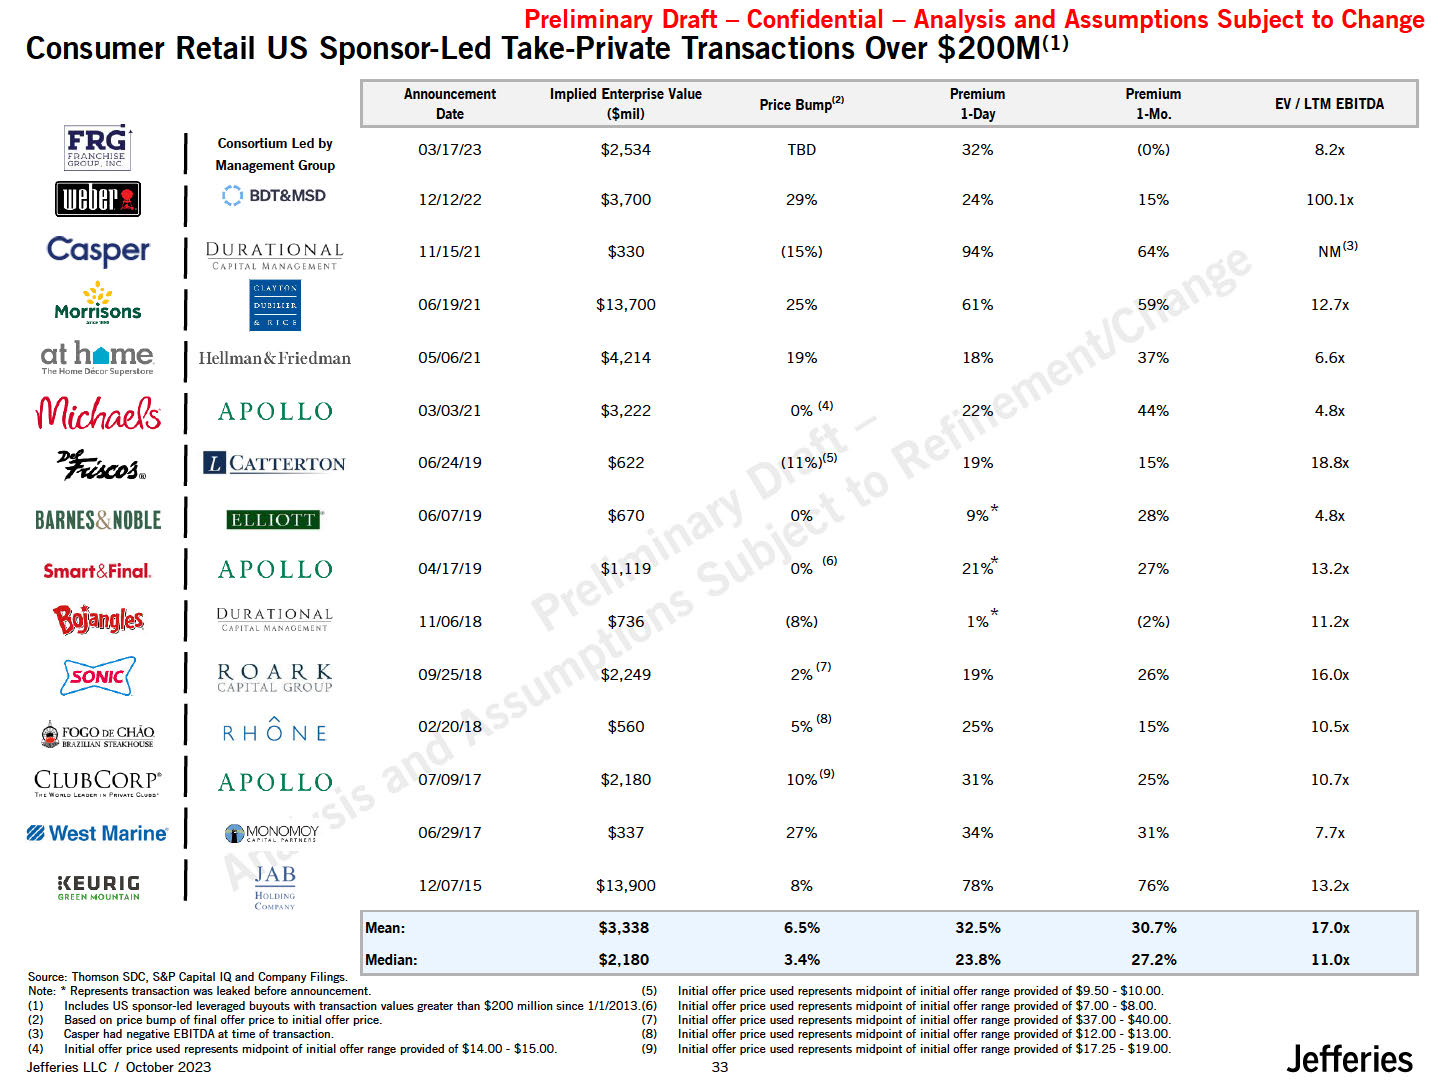
Change Consumer Retail US Sponsor-Led Take-Private Transactions Over $200M<1> Jefferies Jefferies LLC / October 2023 33 Consortium led by Management Group () BDT&MSD Casper DU RAT! ON AL CAPITAl,
MANACtMENT .,:•·•.. ■ Morrisons ath•me Hellman&.Friedman The MoineOCCorSuperdore {Vlichaef's ® APOLLO ICATTERTION lllltllli APOLLO DURATIONAL BARNES&NOBLE Smart&Final. t:1191fAL ,\IA AO(M(i,,-1 Announcement
ImpliedEnterpriseValue Price Bump121 Premium Premium EV I LTM
EBITDA Date ($mil) 1-Day 1-Mo. 03/17/23 $2,534 TBD 32% (0%) 8.2x 12112/22 $3,700 29% 24% 15% 100.lx 11/15/21 $330 (15%) 94% 64% NM<3> 06/19/21 $13,700 25% 61% 59% 12.7x 05/06/21 $4,214 19% 18% 37% 6.6x 03/03/21 $3,222 0%
(4) 22% 44% 4.8x 06/24/19 $622 (11%)(5) 19% 15% 18.Bx 06/07/19 $670 0% 9%* 28% 4.8x 04/17/19 $1,119 0%
(6) 21%* 27% 13.2x 11/06/18 $736 (8%) 1%* (2%) 11.2x 09/25/18 $2,249 2%(7) 19% 26% 16.0x 02120/18 $560 5%(8) 25% 15% 10.5x 07/09/17 $2,180 10%(9) 31% 25% 10.7x 06/29/17 $337 27% 34% 31% 7.7x 12107/15 $13,900 8% 78% 76% 13.2x ROARK CAl'l
fAL GROUP ' . A RHONE FOCO oECHAO lllAZJU\.'\I STf.. liOUSl CLUBCORP. APOLLO 9!:J'2t 1 Y JAB HOLUIMi ('o\lr.,,.,. T , •o ,o 1.....n.,,,. p.,,...,.,,, c.,.,.•>• West
Marine· i<EURICi GRHNMOUHTAIH Mean: Median: $3,338 $2,180 6.5% 3.4% 32.5% 23.8% 30.7% 27.2% 17.0x 11.0x Source: Thomson SOC, S&P Capital IQ and Company Filings. Note: Represents transaction wasleaked before
announcement. (5) Initial offer price used represents midpoint of initial offer range provided of $9.50 • $10.00. (1) Includes US sponsor-led leveraged buyouts with transaction values greater than $200 million since 1/1/2013.(6) Initial offer
price used represents midpoint of initial offer range provided of $7.00 - $8.00. Based on price bump of final offer price to initial offer price. Casper had negative EBITOA at time of transaction. Initial offer price used represents midpoint
of initial offer range provided of $14.00 • $15.00. Initial offer price used represents midpoint of initial offer range provided of $37.00- $40.00. Initial offer price used represents midpoint of initial offer range provided of $12.00 •
$13.00. Initial offer price used represents midpoint of initial offer range provided of $17.25• $19.00.
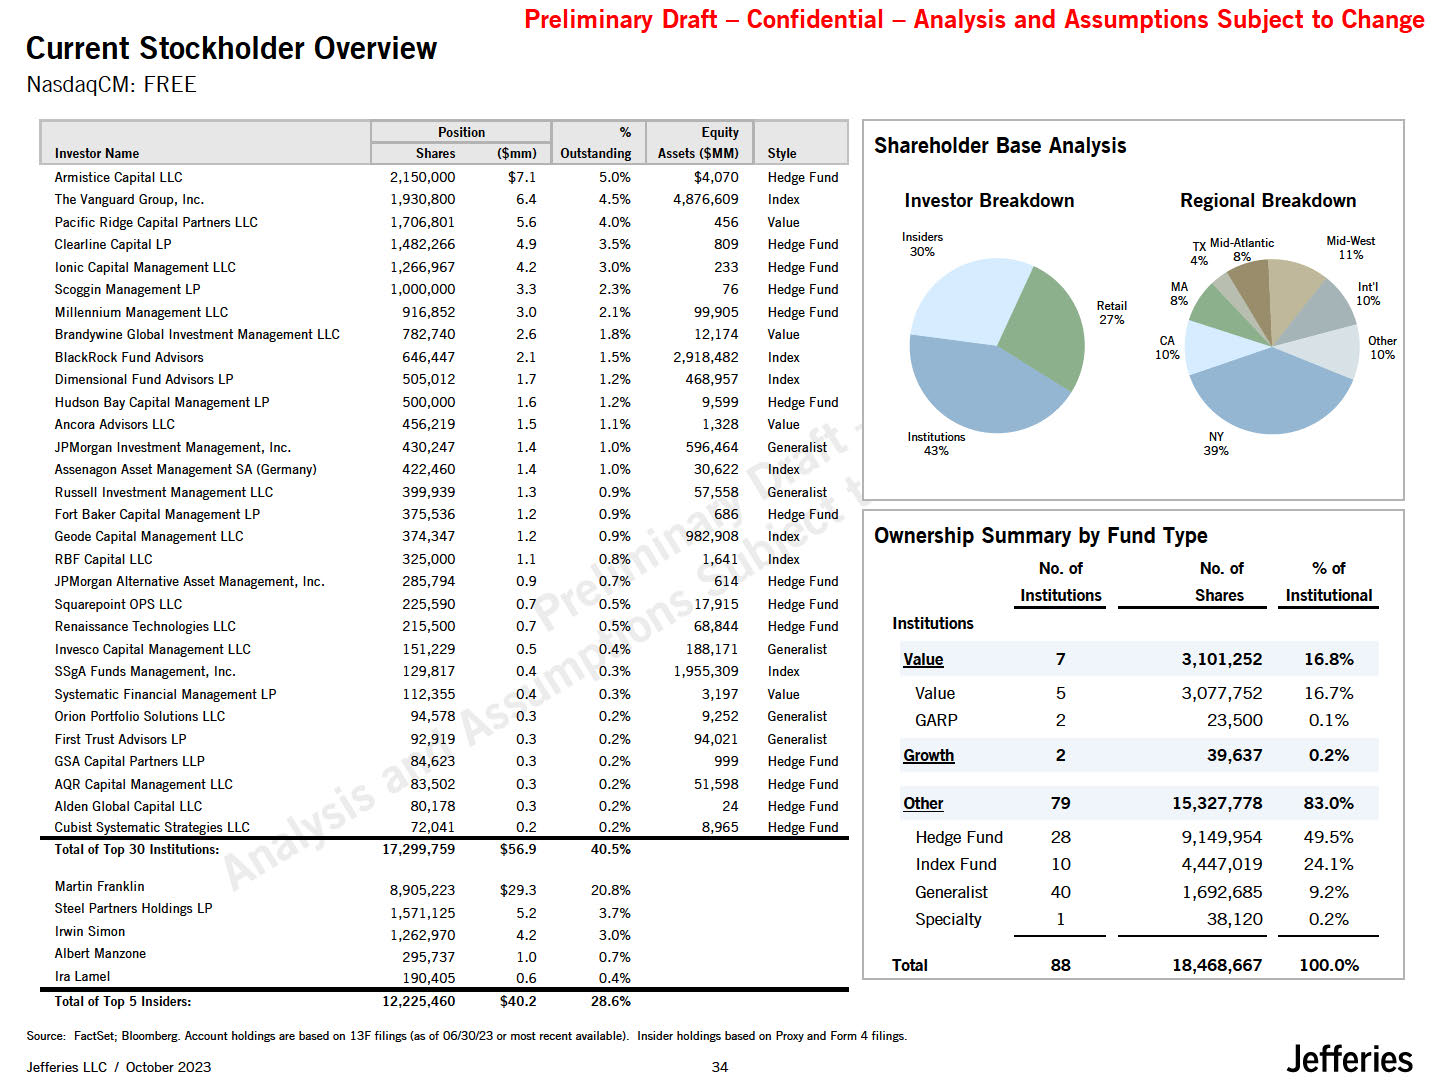
Investor Name Shares ($mm) Outstanding Assets ($MM) Style Armistice Capital
LLC 2,150,000 $7.1 5.0% $4,070 Hedge Fund The Vanguard Group, Inc. 1,930,800 6.4 4.5% 4,876,609 Index Pacific Ridge Capital Partners LLC 1,706,801 5.6 4.0% 456 Value Clearline Capital LP 1,482,266 4.9 3.5% 809 Hedge
Fund Ionic Capital Management LLC 1,266,967 4.2 3.0% 233 Hedge Fund Scoggin Management LP 1,000,000 3.3 2.3% 76 Hedge Fund Millennium Management LLC 916,852 3.0 2.1% 99,905 Hedge Fund Brandywine Global Investment Management
LLC 782,740 2.6 1.8% 12,174 Value BlackRock Fund Advisors 646,447 2.1 1.5% 2,918,482 Index Dimensional Fund Advisors LP 505,012 1.7 1.2% 468,957 Index Hudson Bay Capital Management LP 500,000 1.6 1.2% 9,599 Hedge
Fund Ancora Advisors LLC 456,219 1.5 1.1% 1,328 Value JPMorgan Investment Management, Inc. 430,247 1.4 1.0% 596,464 Generalist Assenagon Asset Management SA (Germany) 422,460 1.4 1.0% 30,622 Index Russell Investment
Management LLC 399,939 1.3 0.9% 57,558 Generalist Fort Baker Capital Management LP 375,536 1.2 0.9% 686 Hedge Fund Steel Partners Holdings LP 1,571,125 5.2 3.7% Irwin Simon 1,262,970 4.2 3.0% Albert
Manzone 295,737 1.0 0.7% Ira Lamel 190,405 0.6 0.4% Total of Top 5 Insiders: 12,225,460 $40.2 28.6% Current Stockholder Overview NasdaqCM: FREE Jefferies Jefferies LLC / October 2023 33 Position % Equity Geode Capital
Management LLC RBF Capital LLC 374,347 325,000 1.2 1.1 0.9% 0.8% 982,908 1,641 Index Index Invesco Capital Management LLC 151,229 0.5 0.4% 188,171 Generalist Orion Portfolio Solutions
LLC 94,578 0.3 0.2% 9,252 Generalist First Trust Advisors LP 92,919 0.3 0.2% 94,021 Generalist Preliminary Draft - Confidential - Analysis and Assumptions Subject to Change Shareholder Base Analysis Investor
Breakdown Insiders 30% Institutions 43% Retail 27% MA 8% CA 10% Regional Breakdown Mid-West 11% lnt'I 10% Other 10% Ownership Summaryby Fund Type No. of No. of %of Institutions Shares Institutional JPMorgan Alternative
Asset Management, Inc. 285,794 0.9 0.7% 614 Hedge Fund Squarepoint OPS LLC 225,590 0.7 0.5% 17,915 Hedge Fund Renaissance Technologies LLC 215,500 0.7 0.5% 68,844 Hedge Fund Institutions Value 7 3,101,252 16.8% SSgA Funds
Management, Inc. 129,817 0.4 0.3% 1,955,309 Index Systematic Financial Management LP 112,355 0.4 0.3% 3,197 Value Value 5 3,077,752 16.7% GARP 2 23,500 0.1% GSA Capital Partners LLP 84,623 0.3 0.2% 999 Hedge
Fund Growth 2 39,637 0.2% AQR Capital Management LLC 83,502 0.3 0.2% 51,598 Hedge Fund Alden Global Capital LLC 80,178 0.3 0.2% 24 Hedge Fund other 79 15,327,778 83.0% Cubist Systematic Strategies LLC 72,041 Total of Top
30 Institutions: 17,299,759 0.2 $56.9 0.2% 8,965 Hedge Fund 40.5% Hedge Fund Index Fund 28 10 9,149,954 4,447,019 49.5% 24.1% Martin Franklin 8,905,223 $29.3 20.8% Generalist 40 1,692,685 9.2% Specialty 1 Total 88 38,120
0.2% 18,468,667 100.0% Source: FactSet; Bloomberg. Account holdings are based on 13F filings (as of 06/30/23 or most recent available). Insider holdings based on Proxy and Form 4 filings.
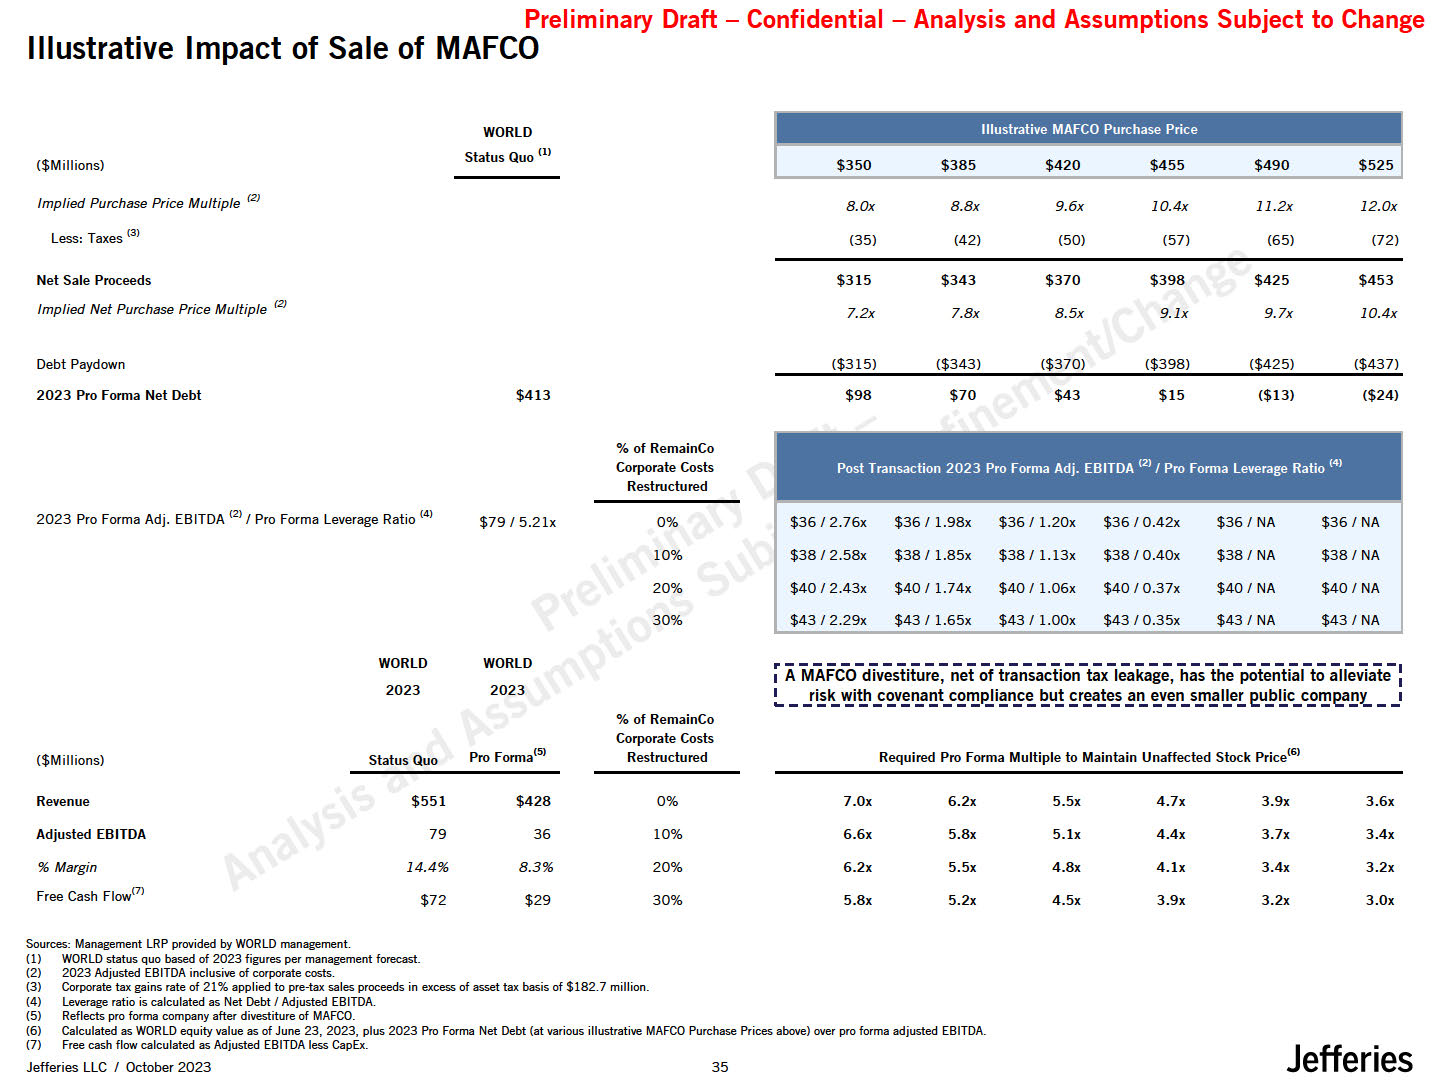
($Millions) WORLD Status Quo <1l iiiiMiiiiiMM:iYiiiii $350 $385 $420 $455
$490 $525 Implied Purchase Price Multiple '21 8.0x 8.Bx 9.6x 10.4x 11.2x 12.0x Less: Taxes<3l (35) (42) (50) (57) (65) (72) Net Sale Proceeds $315 $343 $370 $398 $425 $453 Implied Net Purchase Price Multiple
121 7.2x 7.Bx 8.5x 9.lx 9.7x 10.4x Debt Paydown ($315) ($343) ($370) ($398) ($425) ($437) 2023 Pro Forma Net Debt $413 $98 $70 $43 $15 ($13) ($24) % of RemainCo Corporate Costs Restructured 2023 Pro Forma Adj.
EBITDA<2>/ Pro Forma Leverage Ratio<4l $79 / 5.21x 0% $36 / 2.76x $36 I 1.98x $36 I 1.20x $36 /0.42x $36 / NA $36 / NA 10% $38 I 2.58x $38 I 1.85x $38 I 1.13x $38 /0.40x $38 / NA $38 / NA 20% $40 I 2.43x $40 I
1.74x $40 I 1.06x $40 /0.37x $40 I NA $40/ NA 30% $43 / 2.29x $43 I 1.65x $43 / 1.00x $43 /0.35x $43 / NA $43 / NA Revenue $551 $428 0% 7.0x 6.2x 5.5x 4.7x 3.9x 3.6x Adjusted
EBITDA 79 36 10% 6.6x 5.8x 5.lx 4.4x 3.7x 3.4x % Margin 14.4% 8.3% 20% 6.2x 5.5x 4.8x 4.lx 3.4x 3.2x Free Cash Flowm $72 $29 30% 5.8x 5.2x 4.5x 3.9x 3.2x 3.0x Preliminary Draft - Confidential - Analysis and
Assumptions Subject to Change Illustrative Impact of Sale of MAFCO WORLD 2023 WORLD 2023 % of RemainCo Corporate Costs Restructured ($Millions) Status Quo Pro Forma15> r A MAFCO divestiture, net of transaction tax leakage, has the
potential to alleviate : !._ _ risk with covenant compJiance but creates an even smaller e,ublic come,an _ 1 Jefferies Jefferies LLC / October 2023 33 Required Pro Forma Multiple to Maintain Unaffected Stock Price16> Sources:
Management LRP provided by WORLD management. (1) WORLD status quo based of 2023 figures per management forecast. (2) 2023 Adjusted EBITDA inclusive of corporate costs. (3) (4) (5) (6) (7) Corporate tax gains rate of 21% applied to
pre-tax sales proceeds in excess of asset taxbasis of $182.7 million. Leverage ratio is calculated as Net Debt / Adjusted EBITDA. Reflects pro forma company after divestiture of MAFCO. Calculated as WORLD equity value as of June 23, 2023,
plus 2023 Pro Forma Net Debt (at various illustrative MAFCO Purchase Prices above) over pro forma adjusted EBITDA. Free cash flow calculated as Adjusted EBITDA less CapEx.
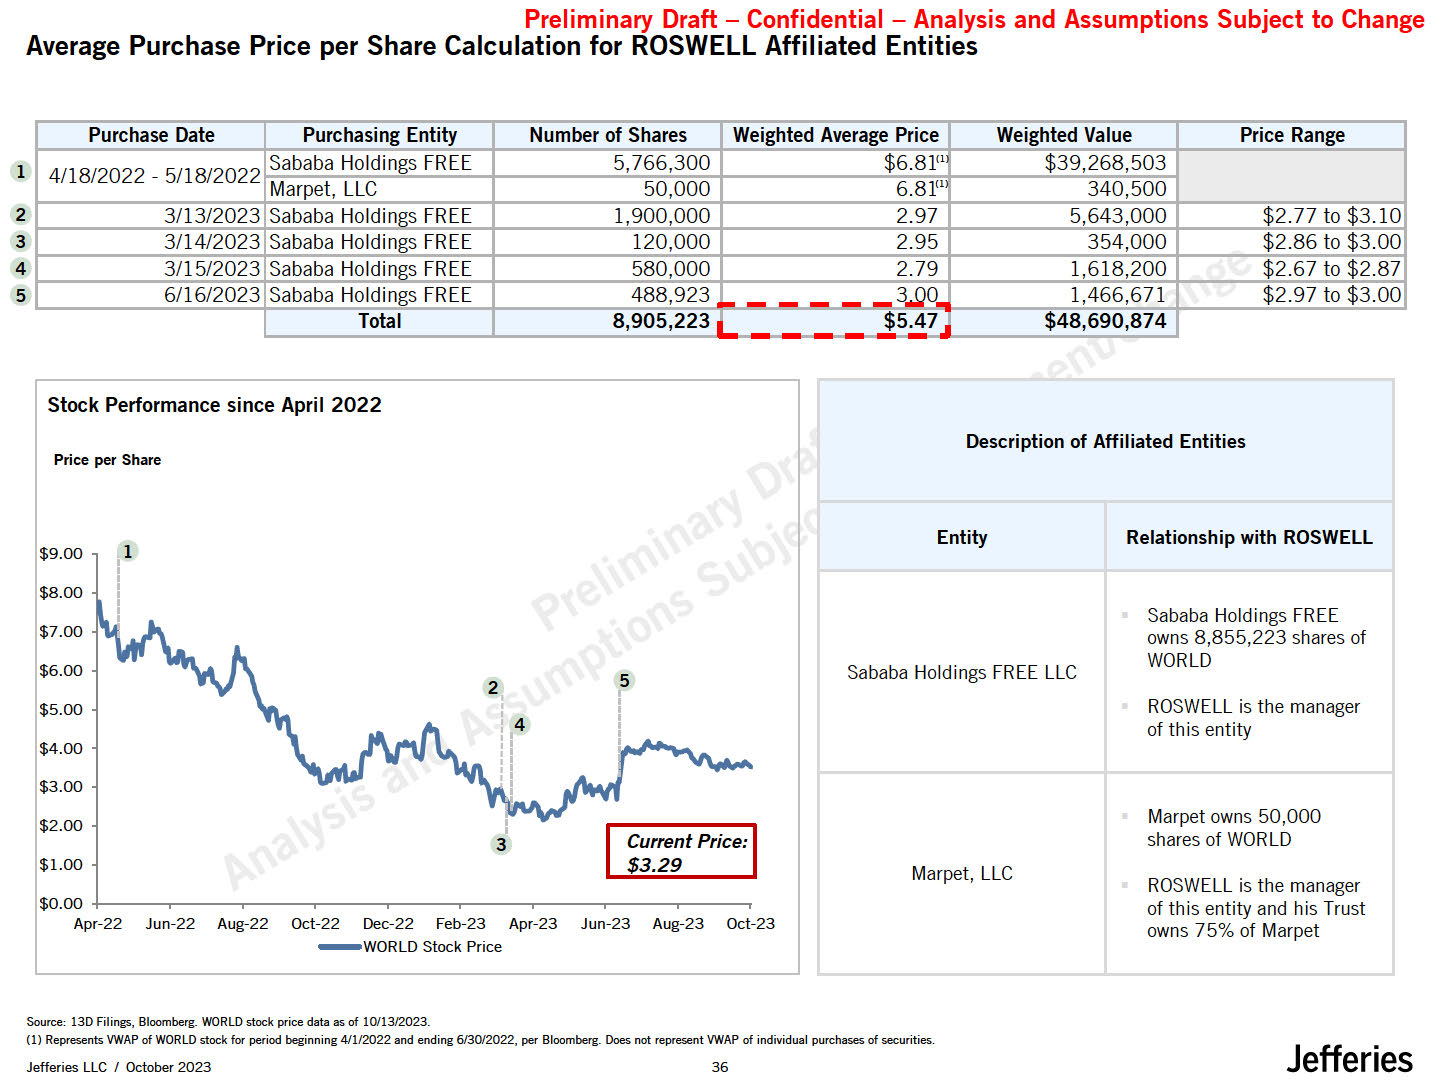
Purchase Date Purchasing Entity Number of Shares Weighted Average
Price Weighted Value Price Range 4/18/2022 - 5/18/2022 Sababa Holdings FREE 5,766,300 $6.81( 1 $39,268,503 Marpet, LLC 50,000 6.81'1 340,500 3/13/2023 Sababa Holdings FREE 1,900,000 2.97 5,643,000 $2.77 to
$3.10 3/14/2023 Sababa Holdings FREE 120,000 2.95 354,000 $2.86 to $3.00 3/15/2023 Sababa Holdings FREE 580,000 2.79 1,618,200 $2.67 to $2.87 6/16/2023 Sababa Holdings FREE 488,923 -- -- - - 3...00_ 1,466,671 $2.97 to
$3.00 Total 8,905,223 $5.47 $48,690,874 Jefferies Jefferies LLC / October 2023 36 Preliminary Draft - Confidential - Analysis and Assumptions Subject to Change Average Purchase Price per Share Calculation for ROSWELL Affiliated
Entities 1 2 3 4 5 Stock Performance since April 2022 Price per Share $9.00 1 $8.00 $7.00 $6.00 $5.00 $4.00 $3.00 $2.00 $1.00 Current Price: $3.29 $0.00 +---.---.-----,-----,----,----,,----,.----,---, Apr-22 Jun-22 Aug-22
Oct-22 Dec-22 Feb-23 Apr-23 Jun-23 Aug-23 Oct-23 -WORLD Stock Price Description of Affiliated Entities Entity Relationship with ROSWELL Sababa Holdings FREELLC Sababa Holdings FREE owns 8,855,223 shares of WORLD ROSWELL is the manager of
this entity Marpet, LLC Source: 13D Filings, Bloomberg. WORLD stock price data as of 10/1312023. (1) Represents VWAP of WORLD stock for period beginning 4/1/2022 and ending 6130/2022, per Bloomberg. Does not represent VWAP of individual
purchases of securities. Marpet owns 50,000 shares of WORLD ROSWELL is the manager of this entity and his Trust owns 75% of Marpet